26. Enzyme Kinetics Explained: Principles, Mechanisms, and Models
Imagine a world where every chemical reaction needed for survival took thousands of years to occur. Life would simply cease to exist. Fortunately, biological catalysts exist to speed up these vital processes. This slide deck explores the foundational principles of how these biological machines operate. By mastering these concepts, students will understand how cellular engines are fueled, regulated, and targeted by life-saving medications. Let us dive into the precise mathematical and structural rules governing these microscopic powerhouses.
Slide 1: Visualizing the Foundations of Enzyme Kinetics
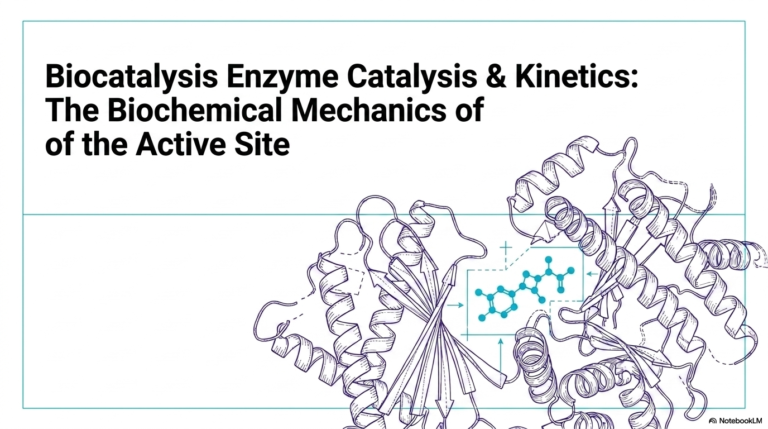
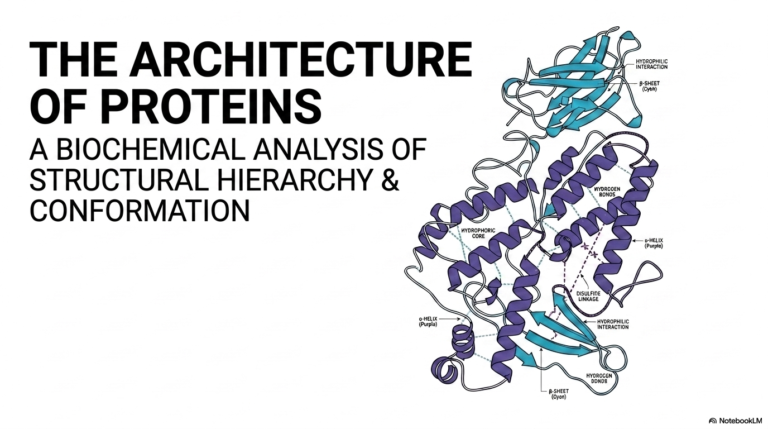
The study of Enzyme Kinetics begins with a clear visualization of the physical interaction between a catalyst and its target. This opening slide illustrates the fundamental docking process, in which a uniquely shaped substrate binds to the protein’s corresponding active site. This geometric complementarity is the cornerstone of all biochemical reactions. Without this precise physical match, the rapid chemical transformations necessary for sustaining cellular life would be impossible.
Furthermore, grasping this visual model is essential for anyone diving into Enzyme Kinetics. It sets the physical stage before introducing complex mathematical equations. The structural alignment dictates the speed and efficiency of the resulting chemical reaction. Medical students must internalize this physical reality, as it directly impacts how physiological systems are regulated and how metabolic pathways operate under varying cellular conditions.
Finally, this physical interaction forms the basis for pharmacological interventions grounded in Enzyme Kinetics. Drug molecules are often designed to mimic these natural substrates, binding to the active site to alter the reaction rate. By gaining a deep understanding of the initial binding event depicted in this slide, future clinicians can better appreciate the structural rationale underlying drug design, metabolic regulation, and targeted medical therapies.
Slide 2: The Core Mechanism of Enzyme Kinetics
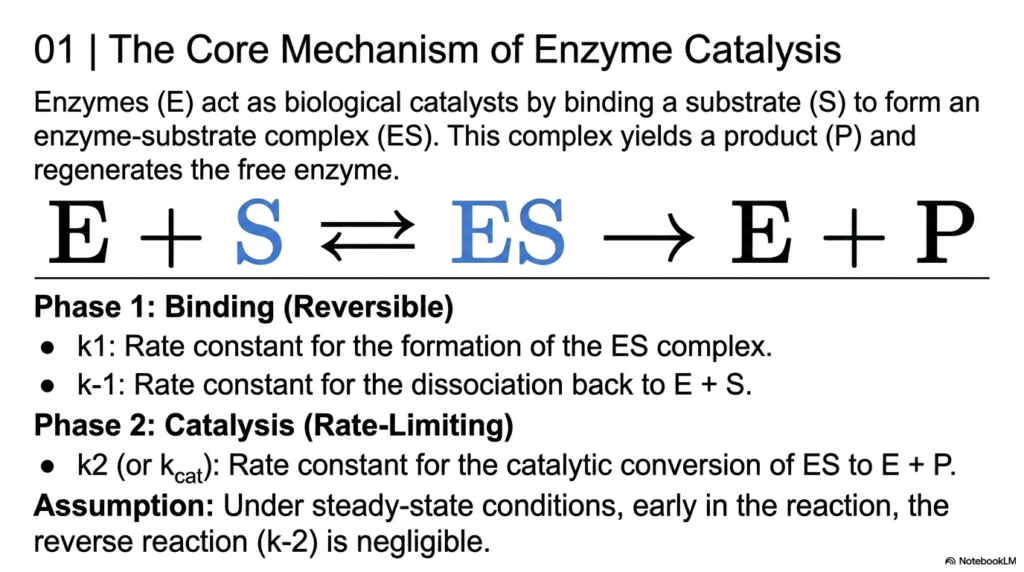
To truly master Enzyme Kinetics, one must understand the fundamental chemical equation governing biological catalysis. This slide breaks down the core mechanism into two distinct phases: binding and catalysis. Initially, the free biological catalyst and substrate reversibly combine to form a temporary complex. The rate constants for this reversible step are denoted as k1 and k-1. This initial binding phase is crucial because it establishes the groundwork for the subsequent chemical transformation.
The second phase of the reaction is the catalytic step, which is typically the rate-limiting portion of the process. Here, the complex is converted into the final product, regenerating the free catalyst. The rate constant for this forward reaction is known as k2 or kcat. In the classical study of Enzyme Kinetics, this step highlights the point of no return for the substrate under specific conditions, ultimately dictating the maximum speed of the biochemical pathway.
A critical mathematical simplification in Enzyme Kinetics is introduced here: the steady-state assumption. Under steady-state conditions, early in the reaction, the reverse reaction converting the product back into the complex is considered negligible. This allows biochemists to measure initial velocities accurately. Understanding these distinct phases and rate constants is vital for medical students analyzing how mutations disrupt cellular metabolism.
Slide 3: Deriving the Michaelis-Menten Equation in Enzyme Kinetics
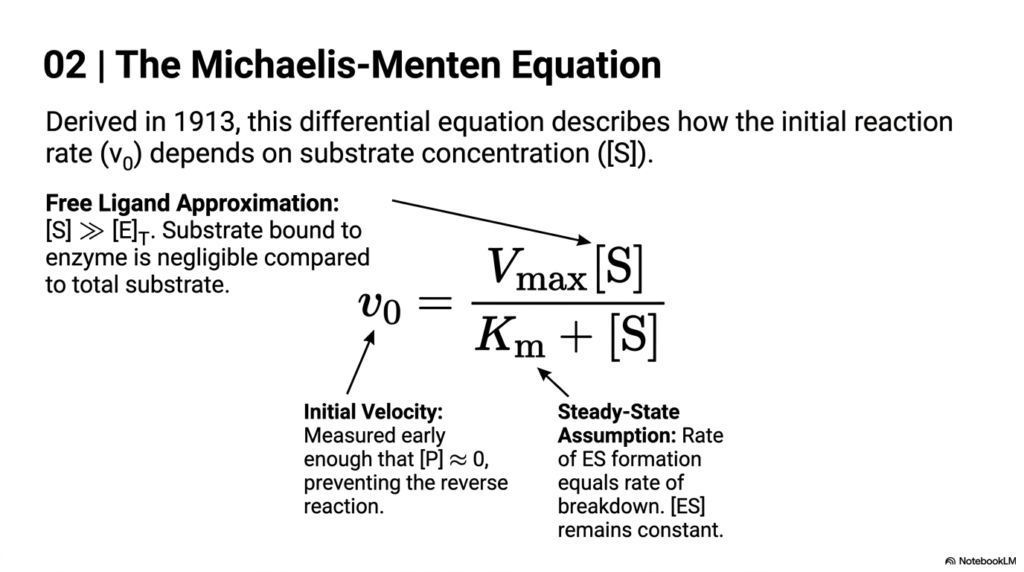
The cornerstone of Enzyme Kinetics is the famous mathematical model derived in 1913. This differential equation describes exactly how the initial reaction rate depends on the substrate concentration. By graphing these variables, biochemists can predict how a biological system will behave under various metabolic loads. The equation mathematically proves that as substrate concentration increases, the reaction velocity increases until it reaches a maximum saturation point.
Two major assumptions make this equation work in Enzyme Kinetics. The first is the Free Ligand Approximation, which states that the amount of substrate bound to the catalyst is negligible relative to the total available substrate. This ensures the concentration of the free substrate remains relatively constant during early measurements. It is a vital concept for students modeling biological pathways in a laboratory setting.
The second pillar of this Enzyme Kinetics model is the Steady-State Assumption. This postulates that the rate of complex formation perfectly equals the rate of its breakdown. Therefore, the concentration of the intermediate complex remains constant throughout the measured phase. Mastering these mathematical boundaries allows future physicians to understand drug dosing and metabolic clearing rates in human pharmacology.
Slide 4: Decoding Kinetic Constants in Enzyme Kinetics
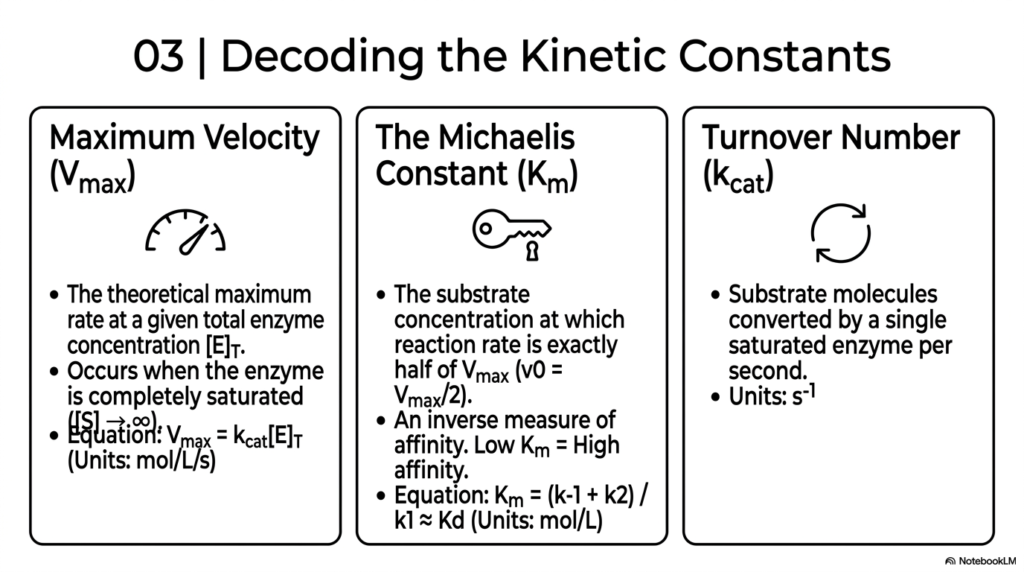
Understanding the specific variables within Enzyme Kinetics is crucial for evaluating biological efficiency. This slide introduces the three primary kinetic constants: Maximum Velocity, the Michaelis Constant, and the Turnover Number. Maximum Velocity represents the theoretical maximum rate at a given total catalyst concentration. This energetic ceiling is reached only when the biological catalyst is fully saturated with substrate, indicating that the system is operating at its absolute maximum capacity.
The Michaelis Constant is perhaps the most famous metric in Enzyme Kinetics. It is defined as the substrate concentration at which the reaction rate is exactly half of the Maximum Velocity. Crucially, it serves as an inverse measure of affinity. A lower constant indicates a high affinity, meaning the catalyst binds its target tightly and efficiently even at low concentrations. Medical students use this value to understand how different tissues utilize resources.
Finally, the Turnover Number represents the pure catalytic power of a single active site in Enzyme Kinetics. It measures how many substrate molecules are converted into product by a single saturated catalyst per second. By analyzing these three distinct constants, researchers can paint a complete mathematical picture of how a specific biochemical pathway performs under physiological stress or during targeted medical treatments.
Slide 5: The Specificity Constant and Efficiency in Enzyme Kinetics
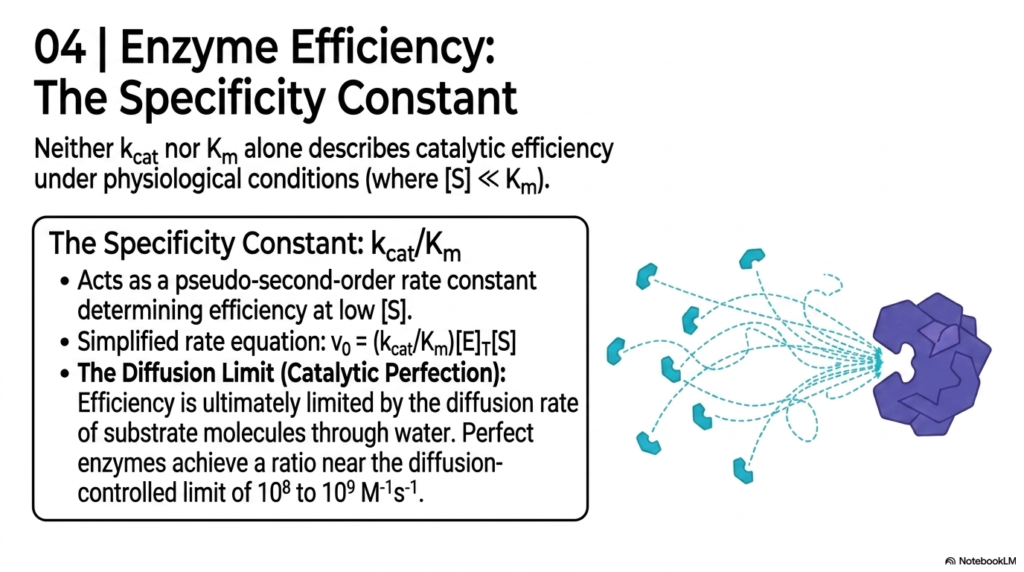
While individual constants are useful, true efficiency in Enzyme Kinetics is measured by the Specificity Constant. Neither the Turnover Number nor the Michaelis Constant alone can fully describe catalytic efficiency under standard physiological conditions, where substrate concentrations are usually quite low. The Specificity Constant acts as a pseudo-second-order rate constant, providing a combined metric that dictates how effectively a biological catalyst operates when targets are scarce.
This slide introduces the Diffusion Limit in Enzyme Kinetics. Efficiency is ultimately capped by the physical laws of the universe, specifically the diffusion rate of substrate molecules moving through water. Perfect biological catalysts achieve a ratio near the diffusion-controlled limit, meaning they process substrates at rates almost exactly equal to the rate at which they physically collide with them in solution.
Understanding catalytic perfection is a thrilling aspect of Enzyme Kinetics for college students. When an active site operates near the diffusion limit, it represents billions of years of evolutionary optimization. These highly evolved biochemical machines are essential for rapid responses in the human body, such as neutralizing toxic cellular byproducts or transmitting instantaneous nerve signals.
Slide 6: Visualizing Enzyme Kinetics: The Hyperbolic Plot
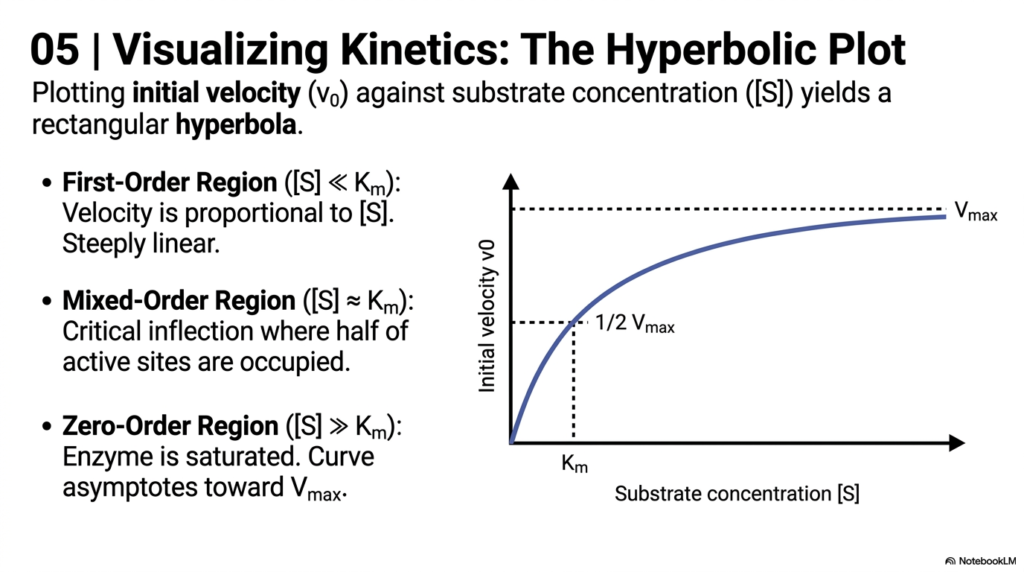
Data visualization is a powerful tool in Enzyme Kinetics. Plotting initial velocity against substrate concentration yields a classic rectangular hyperbola. This distinctive curve visually represents the saturation of active sites. At the origin of the graph, the First-Order Region shows velocity increasing proportionally to the substrate concentration, appearing as a steeply linear region. Here, the catalyst has plenty of available active sites waiting to be filled.
As the concentration increases, the plot enters the Mixed-Order Region in Enzyme Kinetics. This is the critical inflection zone where approximately half of the active sites are occupied. It is precisely in this region that the Michaelis Constant is determined. The gradual flattening of the curve visually demonstrates the diminishing returns of adding more substrate to a biological system that is nearing its maximum processing capacity.
Finally, the curve reaches the Zero-Order Region, a fundamental concept in Enzyme Kinetics. Here, the biological catalyst is fully saturated, and the curve approaches the Maximum Velocity. Adding more substrate at this point will not increase the reaction rate. For medical students, this visualizes why drug toxicity occurs when liver metabolic pathways become fully saturated and can no longer process excess medications.
Slide 7: Linearizing Data in Enzyme Kinetics with Lineweaver-Burk
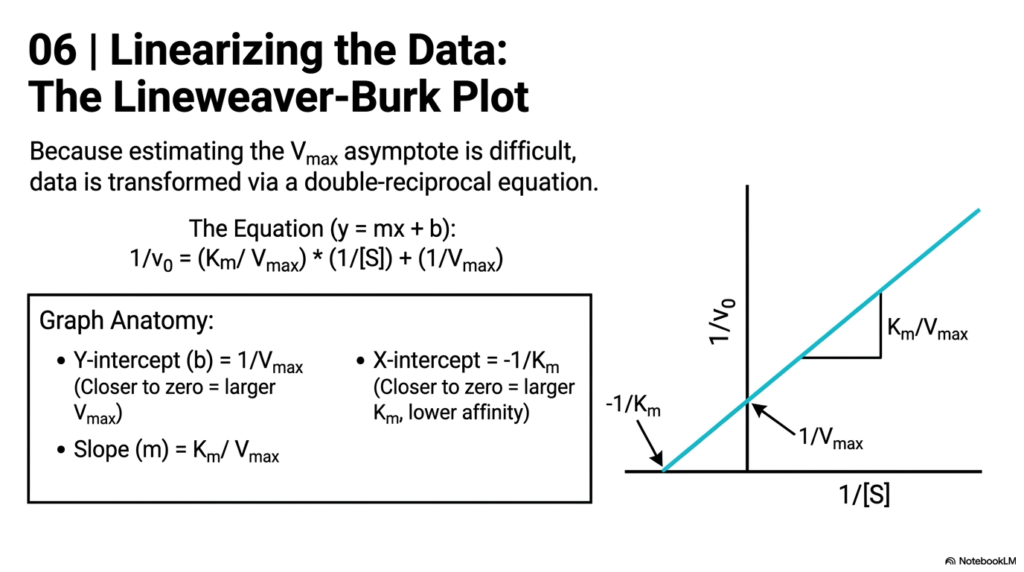
Because estimating the maximum asymptote on a hyperbolic curve is statistically difficult, researchers in Enzyme Kinetics transform the data. This slide introduces the Lineweaver-Burk plot, a double-reciprocal equation that converts the hyperbola into a straight line. By plotting the inverse of velocity against the inverse of substrate concentration, biochemists can extract exact kinetic constants using basic linear algebra.
The anatomy of this graph is a staple of Enzyme Kinetics education. The Y-intercept represents the inverse of the Maximum Velocity; a value closer to zero indicates a higher maximum speed. The X-intercept represents the negative inverse of the Michaelis Constant; a value closer to zero indicates a lower affinity. The slope of the resulting line is the ratio of the two constants, providing a clear visual summary of the system.
Linearizing data remains a critical skill in experimental Enzyme Kinetics. While modern computers can easily fit hyperbolic curves, the double-reciprocal plot allows students to visually distinguish between different types of biochemical inhibition. Understanding how the intercepts and slopes shift on this graph is essential for diagnosing metabolic disorders and determining the precise mechanism of action for new pharmaceutical drugs.
Slide 8: Alternative Derivations in Enzyme Kinetics
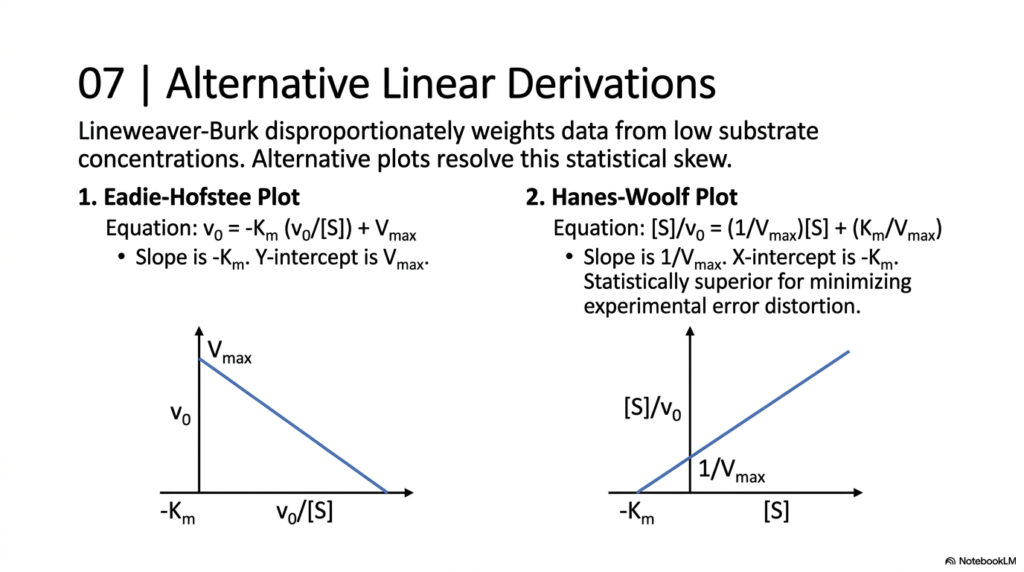
While the Lineweaver-Burk plot is famous in Enzyme Kinetics, it has a significant statistical flaw: it disproportionately weights data from low substrate concentrations, where experimental error is highest. This slide introduces alternative linear derivations designed to resolve this statistical skew. The Eadie-Hofstee Plot and the Hanes-Woolf Plot offer more robust mathematical transformations for determining exact constants from noisy experimental laboratory data.
The Eadie-Hofstee Plot graphs initial velocity against the ratio of velocity to substrate concentration. In this model of Enzyme Kinetics, the Y-intercept directly yields the Maximum Velocity, while the slope provides the negative Michaelis Constant. This approach spreads the data points more evenly across the graph, preventing minor measurement errors at low concentrations from drastically altering the calculated trajectory of the biochemical reaction.
The Hanes-Woolf Plot is widely considered statistically superior in Enzyme Kinetics. Graphing the ratio of substrate to velocity against substrate concentration actively minimizes experimental error distortion. Here, the slope is the inverse of the Maximum Velocity. Teaching these alternative derivations ensures that college students understand the nuances of data analysis, moving beyond basic textbook models to real-world biochemical research applications.
Slide 9: Environmental Modulators of Enzyme Kinetics
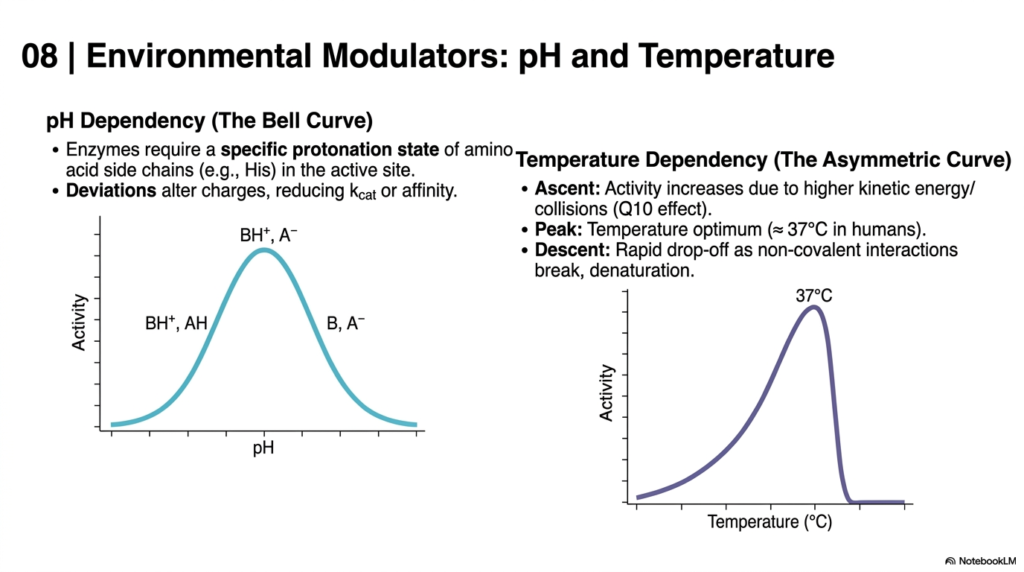
Biological catalysts do not operate in a vacuum; their efficiency is heavily influenced by their surroundings. This slide explores how environmental modulators affect enzyme kinetics, with a focus on pH and temperature. The pH dependency is visualized as a bell curve. Biological catalysts require a highly specific protonation state of amino acid side chains within the active site to function. Deviations alter these delicate charges, drastically reducing affinity or catalytic power.
Temperature dependency introduces an asymmetric curve to Enzyme Kinetics. Initially, as temperature rises, activity increases due to higher kinetic energy and molecular collisions, known as the Q10 effect. The reaction reaches a peak, the temperature optimum, which is approximately normal body temperature in humans. This energetic ascent illustrates how biological systems harness environmental heat to drive chemical reactions forward efficiently.
However, the descent of the temperature curve is a stark warning in Enzyme Kinetics. Pushing temperatures too high causes a rapid drop-off in activity as non-covalent interactions break, leading to denaturation. The biological catalyst physically unravels, losing its functional shape. For medical students, this clearly explains the lethal dangers of severe, prolonged fevers and the physiological importance of precise thermoregulation in the human body.
Slide 10: Structural Basis of Substrate Specificity in Enzyme Kinetics
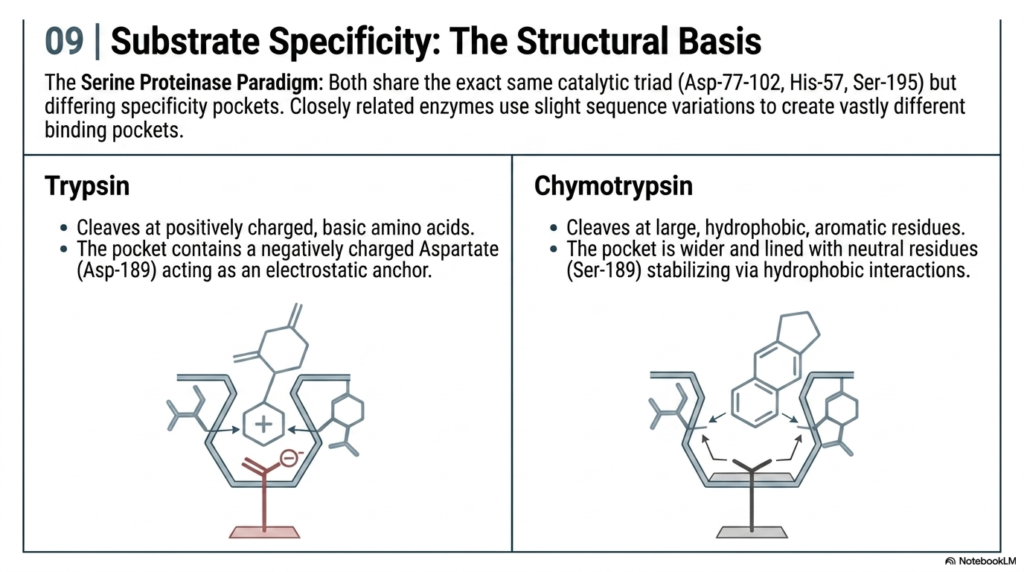
To fully grasp Enzyme Kinetics, one must look closely at the structural anatomy of the active site. This slide uses the Serine Proteinase Paradigm to illustrate how closely related biological catalysts create vastly different binding pockets. Despite sharing the exact same catalytic triad for cutting chemical bonds, slight sequence variations allow these proteins to target entirely different molecular substrates with incredible precision.
Trypsin represents an electrostatic anchor model in Enzyme Kinetics. It specifically cleaves at positively charged, basic amino acids. Its binding pocket contains a negatively charged structural residue that acts as a magnet, perfectly aligning the substrate for the catalytic triad. This illustrates how opposing charges are used to rapidly secure targets, thereby increasing the overall efficiency of the biochemical reaction.
Conversely, Chymotrypsin utilizes a different structural strategy in Enzyme Kinetics. Its pocket is wider and lined with neutral residues, specifically designed to bind large, hydrophobic, aromatic rings. It stabilizes the target through hydrophobic interactions rather than electrical charges. Highlighting these structural differences helps medical students understand how the digestive system uniquely processes various dietary proteins using highly specialized, mathematically predictable biochemical machinery.
Slide 11: Bisubstrate Reactions in Enzyme Kinetics
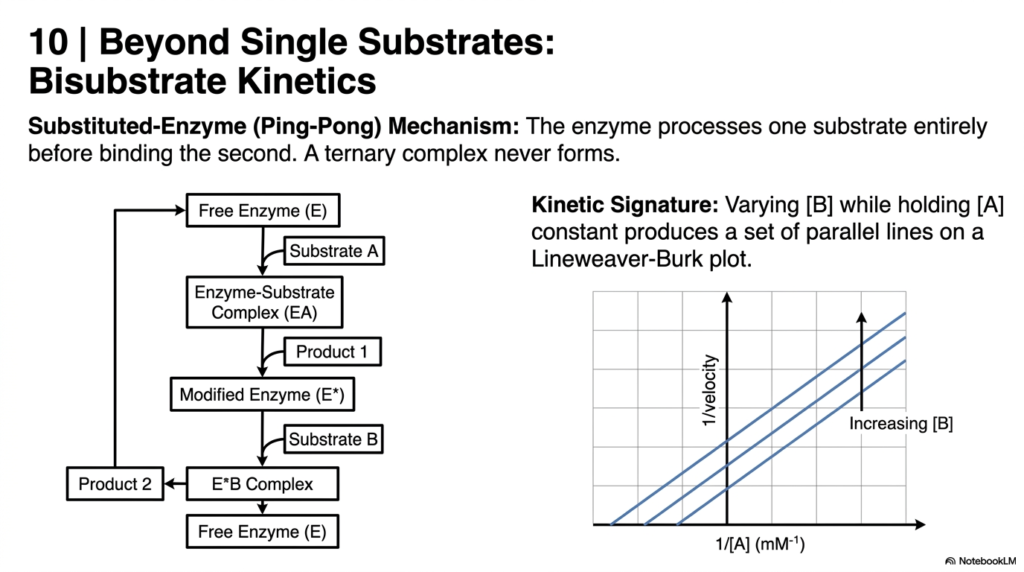
Most introductory models focus on a single target, but advanced Enzyme Kinetics often involves bisubstrate reactions. This slide introduces the Substituted-Enzyme, or Ping-Pong, Mechanism. In this fascinating chemical dance, the biological catalyst processes the first substrate entirely and releases the product before ever binding the second substrate. A ternary complex containing all three components simultaneously never actually forms during the reaction cycle.
The kinetic signature of the Ping-Pong mechanism is uniquely identifiable in Enzyme Kinetics. When analyzing this reaction on a Lineweaver-Burk plot, varying the concentration of the second substrate while holding the first constant produces a distinctive set of parallel lines. This visual pattern is a hallmark diagnostic tool for researchers trying to deduce the exact molecular sequence of complex metabolic pathways.
Understanding bisubstrate reactions is crucial for mastering real-world Enzyme Kinetics. Many vital metabolic processes, including the transfer of amino groups during protein metabolism, utilize this exact mechanism. For medical students, recognizing these parallel kinetic signatures aids in understanding complex drug interactions and how certain biological toxins can interrupt multi-step biochemical relay systems within human cells.
Slide 12: Competitive Inhibition in Enzyme Kinetics
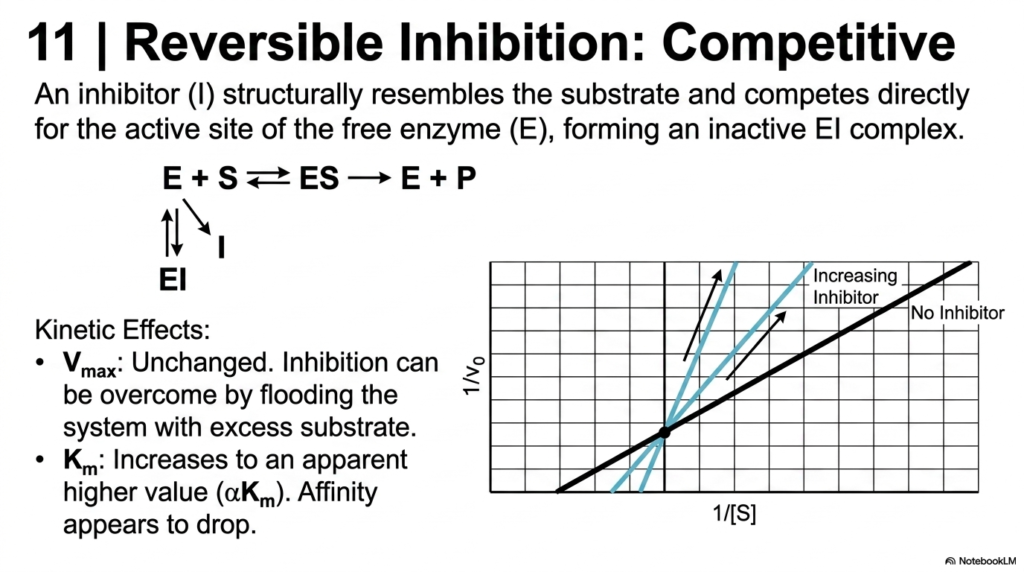
The study of how reactions are slowed or stopped is a massive component of Enzyme Kinetics. This slide details Competitive Inhibition, a reversible process where an inhibitor structurally resembles the natural substrate. The inhibitor competes directly for the active site of the free biological catalyst, forming an inactive complex. Because it blocks the docking port, the natural chemical reaction is temporarily halted.
The kinetic effects of this competition are distinct in Enzyme Kinetics. Because the inhibitor and substrate compete for the same binding site, the inhibition can be completely overcome by flooding the system with excess substrate. Consequently, the Maximum Velocity of the system remains unchanged. The biological catalyst can still reach its top speed; it just requires a significantly higher concentration of raw material to outcompete the inhibitor.
However, the Michaelis Constant increases, indicating that the apparent affinity has dropped. In a double-reciprocal plot used in Enzyme Kinetics, the lines intersect exactly on the Y-axis. Mastering this specific inhibition profile is paramount for pharmacology students, as many common medications, such as statins, are designed as direct competitive inhibitors of cholesterol production.
Slide 13: Uncompetitive Inhibition in Enzyme Kinetics
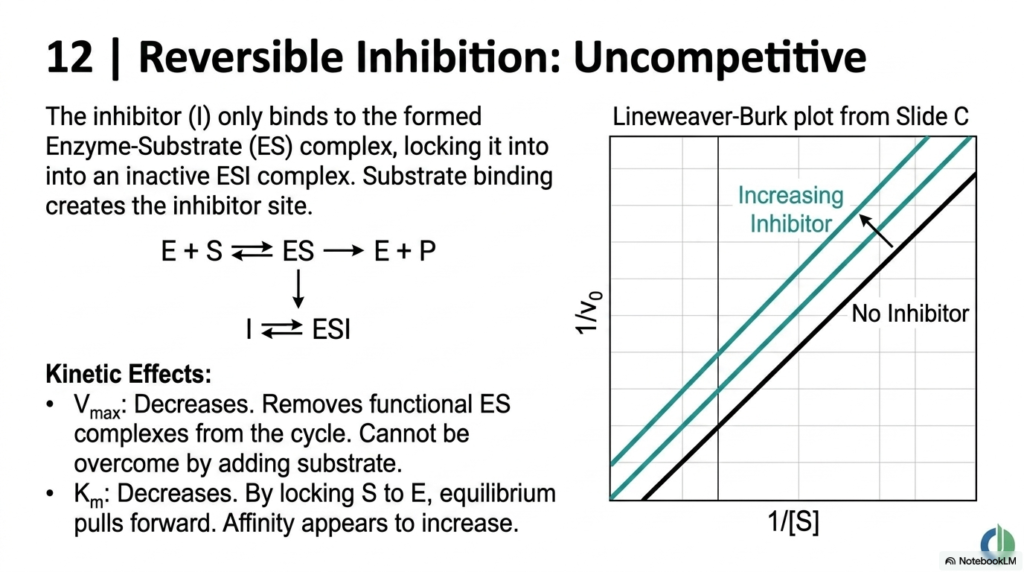
Moving beyond direct competition, this slide introduces Uncompetitive Inhibition to the study of Enzyme Kinetics. In this scenario, the inhibitor does not bind to the free biological catalyst at all. Instead, it only binds to the already formed enzyme-substrate complex. Paradoxically, it is the actual binding of the natural substrate that creates the physical docking site for this specific type of molecular inhibitor.
The kinetic consequences here are unique within Enzyme Kinetics. Because the inhibitor locks the complex into an inactive state, it essentially removes functional biochemical machinery from the cycle. This cannot be overcome by simply adding more substrate. As a result, the system’s overall Maximum Velocity decreases. The system’s maximum processing speed is permanently reduced while the inhibitor is present.
Interestingly, the Michaelis Constant also decreases in this model of Enzyme Kinetics. By locking the substrate to the catalyst, the equilibrium is pulled forward, making the apparent affinity seem to increase. On a Lineweaver-Burk plot, this dual decrease results in a distinct set of parallel lines. Understanding this mechanism is vital for medical students studying complex agricultural toxins and specific neurological medications.
Slide 14: Non-competitive and Mixed Inhibition in Enzyme Kinetics
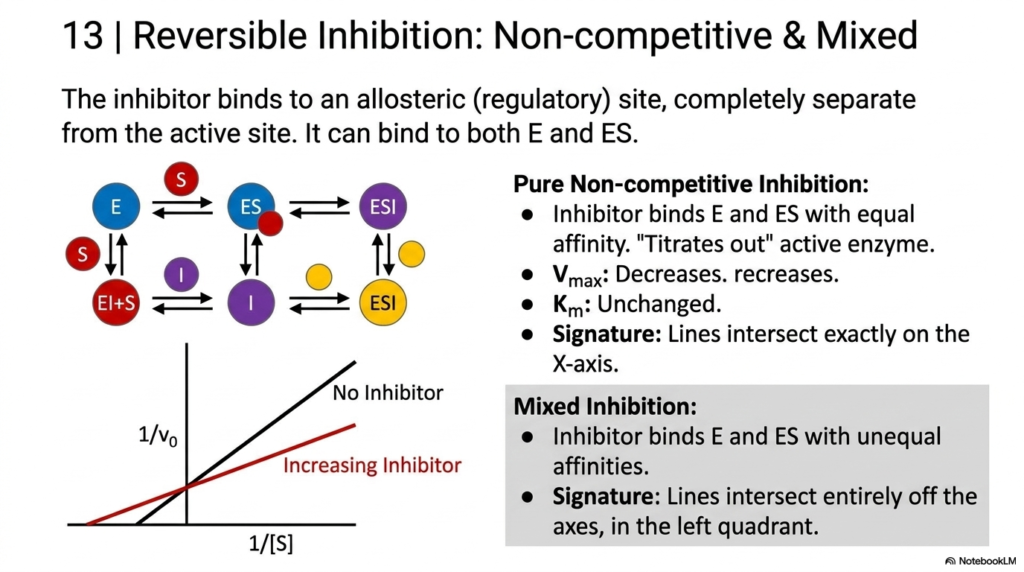
The final major categories of reversible regulation in Enzyme Kinetics involve binding away from the active site. This slide covers Non-competitive and Mixed Inhibition, in which the inhibitor binds to an allosteric (regulatory) site. This can occur on both the free biological catalyst and the fully formed complex. Because it binds elsewhere, it does not physically block the substrate, but rather alters the machine’s functional shape.
Pure Non-competitive Inhibition is a rare but important concept in Enzyme Kinetics. Here, the inhibitor binds the free catalyst and the complex with perfectly equal affinity. It effectively “titrates out” the active catalyst, lowering the Maximum Velocity without altering the Michaelis Constant. The apparent affinity remains unchanged. On a linear graph, this produces a distinct signature in which the lines intersect exactly at the X-axis.
Mixed Inhibition is far more common in physiological Enzyme Kinetics. In this scenario, the inhibitor binds to the free catalyst and the complex with unequal affinities, affecting both the maximum speed and the apparent affinity simultaneously. The graphical signature is an intersection point that falls entirely off the axes, floating in the left quadrant. Mastering these allosteric regulations is crucial for understanding natural cellular feedback loops.
Slide 15: Synthesis Matrix for Inhibition in Enzyme Kinetics
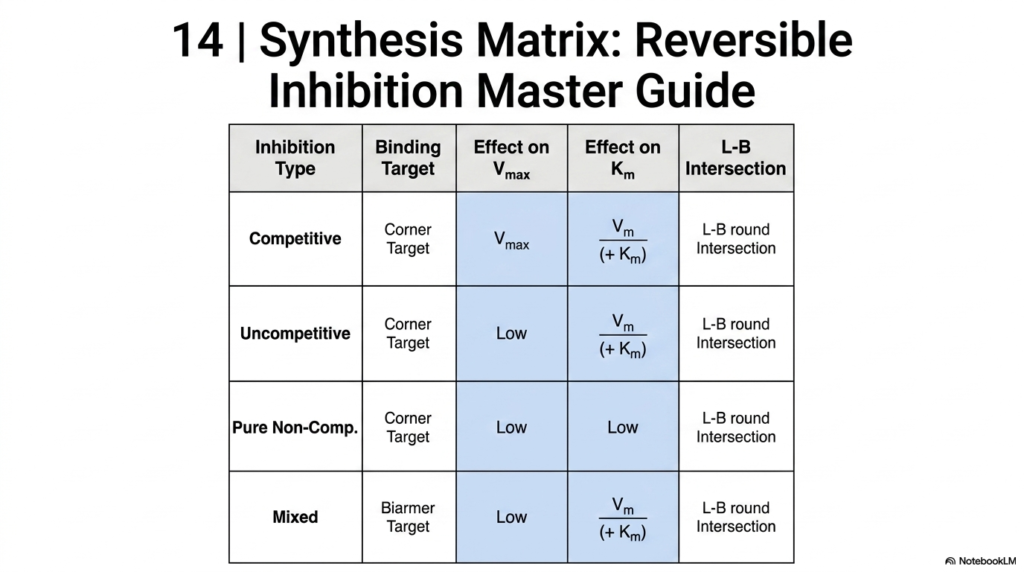
To successfully navigate the complexities of Enzyme Kinetics, a consolidated synthesis matrix is an invaluable study tool. This final slide serves as a master guide to all types of reversible inhibition. It cleanly organizes Competitive, Uncompetitive, Pure Non-Competitive, and Mixed inhibition into a single comparative table. By placing these mechanisms side by side, students can quickly memorize the varying effects on Maximum Velocity and apparent affinity.
The matrix clearly highlights the diagnostic signatures used in Enzyme Kinetics. It details exactly where the data lines will intersect on a Lineweaver-Burk plot for each inhibitor type. Whether the intersection lies on the Y-axis, the X-axis, is parallel to each, or falls in the left quadrant, this quick-reference guide ensures rapid identification during laboratory analysis or academic examinations.
Ultimately, mastering this summary matrix represents the culmination of a student’s journey through basic Enzyme Kinetics. It bridges the gap between theoretical math, structural biochemistry, and practical data interpretation. For aspiring medical professionals and biochemists, internalizing this chart is a vital step toward understanding advanced pharmacology, diagnosing metabolic diseases, and contributing to the future of biological research.
Please read our Content Disclaimer Statement.
Check out our social media channels: