64. Centrifugation Analysis: Principles, Theory, and Analytical Techniques
Centrifugation Analysis: How Scientists Isolate the Building Blocks of Life
How do scientists extract a single protein or a specific DNA strand from the complex soup of a living cell? The secret lies in manipulating physics. This slide deck breaks down the core principles of separation techniques used daily in biochemical research. The following guide provides a comprehensive overview of how researchers harness immense rotational forces to study cellular components, transforming microscopic biological mysteries into measurable, life-saving data.
Slide 1: Mastering Centrifugation Analysis
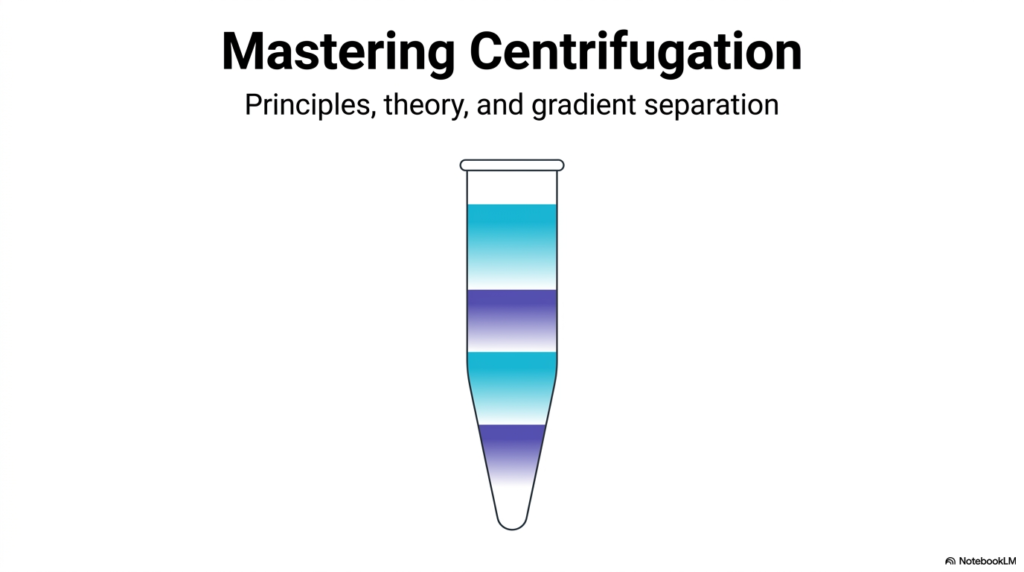
The journey into the microscopic realm begins with understanding basic separation techniques. In modern biochemistry, centrifugation analysis is a foundational method for isolating cellular components. Slide one introduces the core theme of mastering this technique and highlights the visual beauty of gradient separation. When researchers look at a test tube with distinct, colorful bands, they are witnessing the elegant sorting of complex biological mixtures into pure, distinct fractions.
To fully grasp Centrifugation Analysis, students must recognize that biological samples are messy. A homogenized cell contains proteins, lipids, nucleic acids, and organelles all jumbled together. Simply looking at this mixture under a microscope is not enough to study the individual functions of these macromolecules. Scientists need a reliable way to separate them without destroying their delicate structures. This is where advanced gradient separation comes into play.
By layering solutions of different densities, researchers create a physical environment where molecules can be sorted based on their unique physical properties. The gradient acts as a sort of microscopic sieve, driven by gravity and rotational force rather than a physical mesh. Understanding this visual representation on the first slide prepares medical and college students for the mathematical and physical principles that dictate how these bands form.
Ultimately, the goal of Centrifugation Analysis is to turn chaos into order. The distinct colored bands shown in the tube represent actual biological macromolecules suspended in a stabilizing matrix. These visual bands are the ultimate reward of a successful experiment. This visual starting point is a gateway to the detailed physics that make such discoveries possible, setting the stage for the deep dive into gravitational forces, rotor mechanics, and mathematical kinetics.
Slide 2: Overcoming Gravity with Centrifugation Analysis
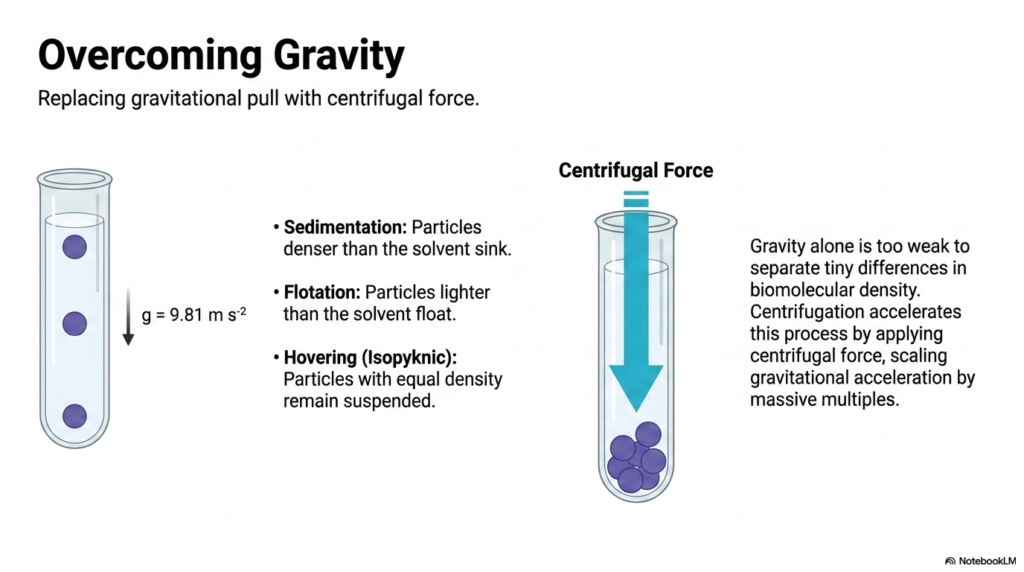
Gravity is a constant force, but it is incredibly weak at the microscopic scale. Slide two demonstrates why simple gravity is insufficient for separating tiny biomolecular differences, necessitating the use of Centrifugation Analysis. If a scientist leaves a tube of cellular extract sitting on a benchtop, standard gravitational acceleration might eventually settle the largest debris, but it will never separate the tiny proteins or ribosomes floating within the solvent.
To solve this problem, Centrifugation Analysis replaces the Earth’s natural gravitational pull with artificial centrifugal force. By spinning the test tube at high speeds, the machine multiplies the gravitational acceleration by many orders of magnitude. This immense force acts upon the particles in three distinct ways depending on their density relative to the surrounding liquid solvent. These three behaviors are known as sedimentation, flotation, and hovering.
Sedimentation occurs when particles are denser than the solvent; the applied force drives them straight to the bottom of the tube. Conversely, flotation occurs when particles are lighter than the surrounding liquid, causing them to rise to the surface. The most fascinating state is hovering, also known as the isopyknic point. Here, the particles possess a density exactly equal to that of the solvent, remaining perfectly suspended in the middle of the tube.
Understanding these three behavioral states is critical for any student learning Centrifugation Analysis. By manipulating the solvent density and the spin speed, a researcher can precisely control where a specific organelle or macromolecule ends up. The illustration clearly contrasts the slow, ineffective pull of Earth’s gravity with the powerful, directed arrow of centrifugal force. This fundamental concept scales up a weak force into an immensely powerful laboratory tool.
Slide 3: Rotor Dynamics and Centrifugation Analysis
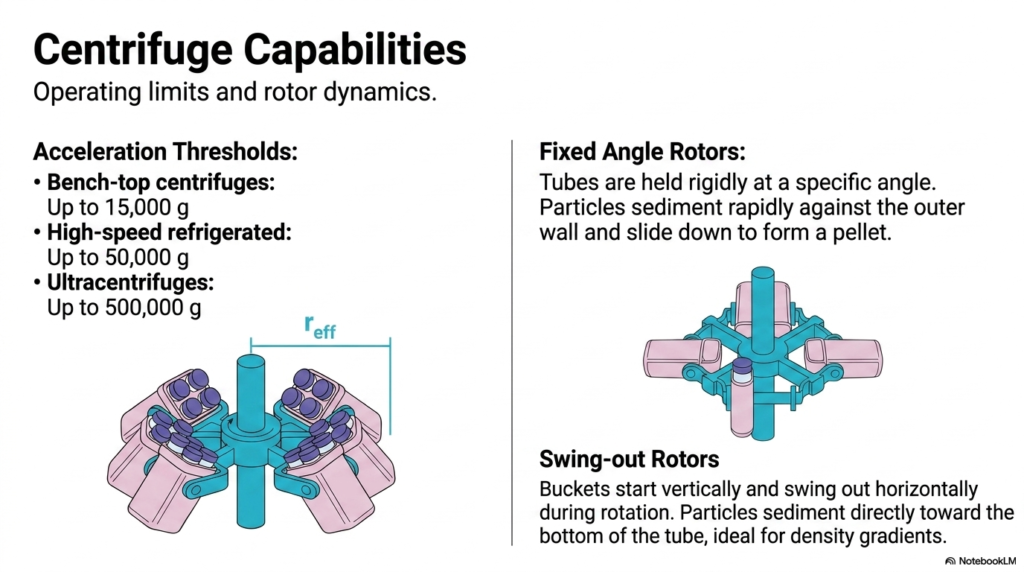
The machines that drive separation are engineering marvels. Slide three breaks down the operational limits and rotor dynamics essential for performing robust Centrifugation Analysis. Different experimental needs require vastly different acceleration thresholds. For routine laboratory tasks, bench-top machines generate up to 15,000 times the force of gravity. When tackling more demanding separations, high-speed refrigerated units can reach 50,000 g, keeping sensitive samples cool during intense friction.
For the ultimate molecular isolation, scientists utilize ultracentrifuges capable of reaching a staggering 500,000 g. These machines are the heavy artillery of Centrifugation Analysis, operating in a vacuum to prevent air friction from boiling the samples. Beyond just raw speed, the physical orientation of the spinning tubes plays a massive role in how particles behave. The slide highlights two primary rotor designs: fixed-angle rotors and swing-out rotors.
In fixed-angle rotors, the sample tubes are held rigidly at a specific, unchanging angle. As the machine spins, particles are forced outward and rapidly sediment against the outer wall of the tube before sliding down to form a solid pellet at the bottom. This design is highly efficient for quickly separating dense cellular debris from the lighter liquid components, making it a staple in everyday laboratory protocols for initial cellular clearing.
Alternatively, swing-out rotors start in a vertical position but hinge outward to become completely horizontal as rotational speed increases. This horizontal alignment is critical for precise Centrifugation Analysis involving density gradients. Because the centrifugal force acts straight down the center axis of the tube, particles sediment in perfectly flat bands rather than hitting the side walls. Mastering the interplay between these immense speeds and distinct rotor geometries empowers researchers to tackle complex biological puzzles efficiently.
Slide 4: Sedimentation Kinetics in Centrifugation Analysis
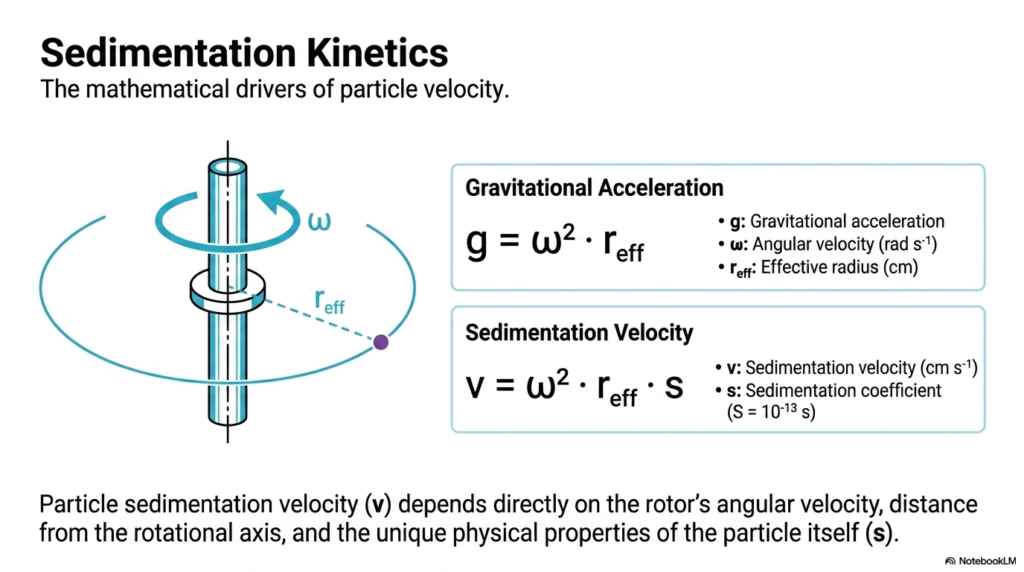
Moving from mechanical engineering to physical mathematics, slide four explains the exact mathematical drivers of particle velocity. To perform precise Centrifugation Analysis, a researcher must understand the kinetic equations that govern how fast a particle will travel through a solution. The applied gravitational acceleration is no longer a constant from the Earth; it is a calculated value based on the rotor’s angular velocity squared and the effective radius.
The fundamental equation for artificial gravity dictates that spinning a rotor faster or placing the sample further from the central axis exponentially increases the force exerted on the biological material. However, calculating the actual speed at which a particle sinks requires the sedimentation velocity equation. This formula forms the theoretical heart of Centrifugation Analysis, proving that velocity depends on more than just the machine’s mechanical settings.
Sedimentation velocity equals the angular velocity squared, multiplied by the effective radius, and finally by a unique variable known as the sedimentation coefficient. This means that while the researcher controls the machine’s speed and the rotor size, the particle itself inherently dictates how it will react to those forces. Two different proteins subjected to the same spin will travel at different speeds depending on their specific physical properties.
For students mastering Centrifugation Analysis, this mathematical relationship explains why separation is even possible. The angular velocity and effective radius provide the driving force, but the sedimentation coefficient uniquely identifies every biological macromolecule. Without these mathematical foundations, laboratory work would be reduced to mere guesswork. These formulas bridge the gap between abstract physics and tangible biological discovery, allowing medical researchers to design highly precise protocols.
Slide 5: Anatomy of the S-Value for Centrifugation Analysis
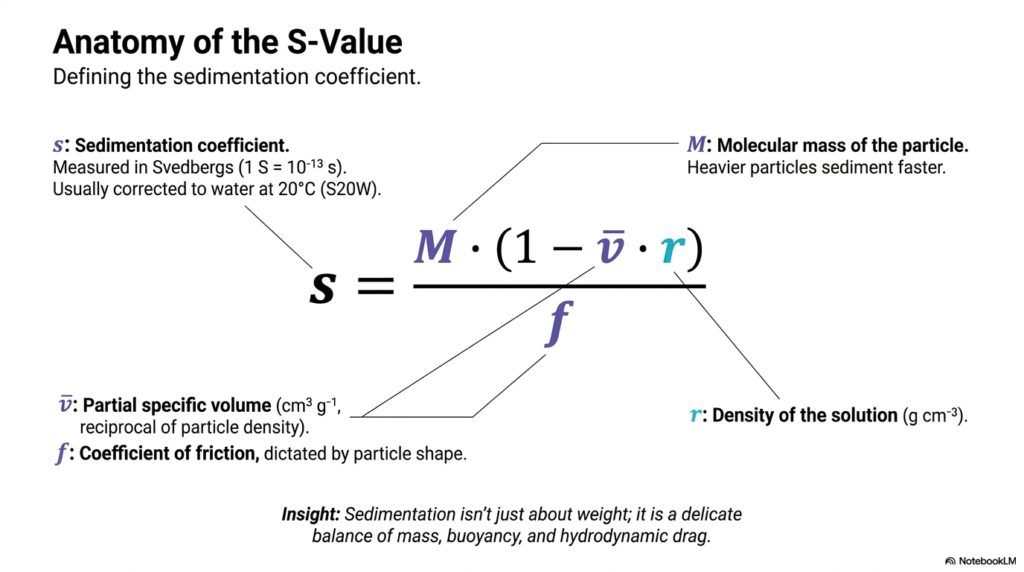
Slide five unpacks the sedimentation coefficient, commonly known as the S-value, which is arguably the most important metric in Centrifugation Analysis. The sedimentation coefficient is measured in Svedberg units, named after the inventor of the ultracentrifuge. It is a complex value that precisely describes how a macromolecule behaves under centrifugal force, mathematically unifying the particle’s mass, buoyancy, and shape into a single number.
The formula reveals that sedimentation is not solely about how heavy a molecule is. The numerator of the equation incorporates the molecular mass multiplied by a buoyancy factor. This buoyancy factor accounts for the particle’s partial specific volume and the density of the surrounding solution. If a particle has a density identical to the solution, this part of the equation becomes zero, meaning sedimentation stops entirely, a crucial concept in advanced Centrifugation Analysis.
The denominator of the S-value equation introduces the coefficient of friction, which is determined by the particle’s shape. A compact, spherical protein will encounter very little hydrodynamic drag and sediment rapidly. In contrast, an elongated, fibrous protein of the exact same mass will experience immense friction, drastically slowing its movement through the fluid. Therefore, two molecules with identical weights can have wildly different S-values based purely on their structural conformation.
Understanding the anatomy of the S-value is a transformative moment for students studying Centrifugation Analysis. It highlights that separation is a delicate balance of physical forces. Biochemists leverage this complex interplay of mass, buoyancy, and hydrodynamic drag to isolate structures that might otherwise seem identical. This mathematical insight is exactly what allows researchers to map out the different components of cellular machinery with incredible precision.
Slide 6: The Density and S-Value Landscape in Centrifugation Analysis
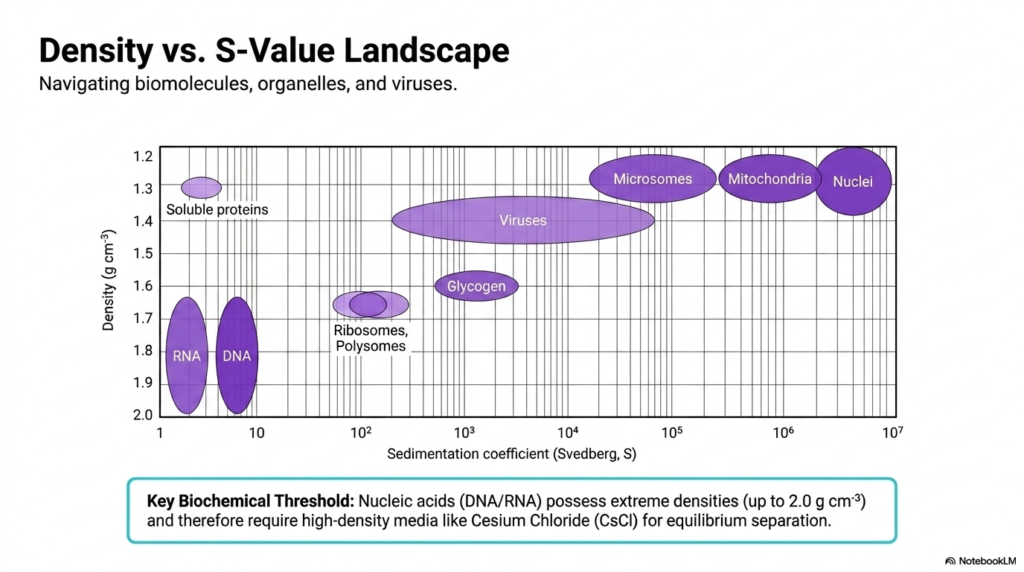
Visualizing where different cellular components fall on a spectrum is vital for experimental design. Slide six provides a comprehensive landscape mapping various biomolecules, organelles, and viruses based on their intrinsic density and sedimentation coefficient. This two-dimensional chart is an indispensable roadmap for performing targeted Centrifugation Analysis. It visually explains why separating different biological structures requires entirely different media and experimental parameters.
When examining the chart, one immediately notices the vast differences in physical properties across biological matter. Soluble proteins have very low S-values but sit in the middle of the density spectrum. On the far right of the chart, massive cellular organelles such as mitochondria and entire nuclei exhibit enormous sedimentation coefficients due to their sheer mass and size. Identifying where a target molecule sits on this landscape dictates the entire approach to a Centrifugation Analysis experiment.
A critical biochemical threshold highlighted on this slide relates to nucleic acids. DNA and RNA possess extreme structural densities, reaching up to 2.0 grams per cubic centimeter. Because they are significantly denser than proteins, lipids, and standard organelles, they require specialized, high-density media for equilibrium separation. This is why heavy metal salts like Cesium Chloride are absolutely necessary when biochemists want to isolate pure genetic material.
By studying this landscape, students learn that Centrifugation Analysis is highly customizable. You cannot use the same gradient material to separate a lightweight protein that you would use to isolate ultra-dense RNA. The clustering of ribosomes and viruses in the central region illustrates how closely related some structures are. Mastering this landscape empowers researchers to navigate the cell’s complex internal environment and extract exactly what they need.
Slide 7: Stabilizing Gradients for Centrifugation Analysis
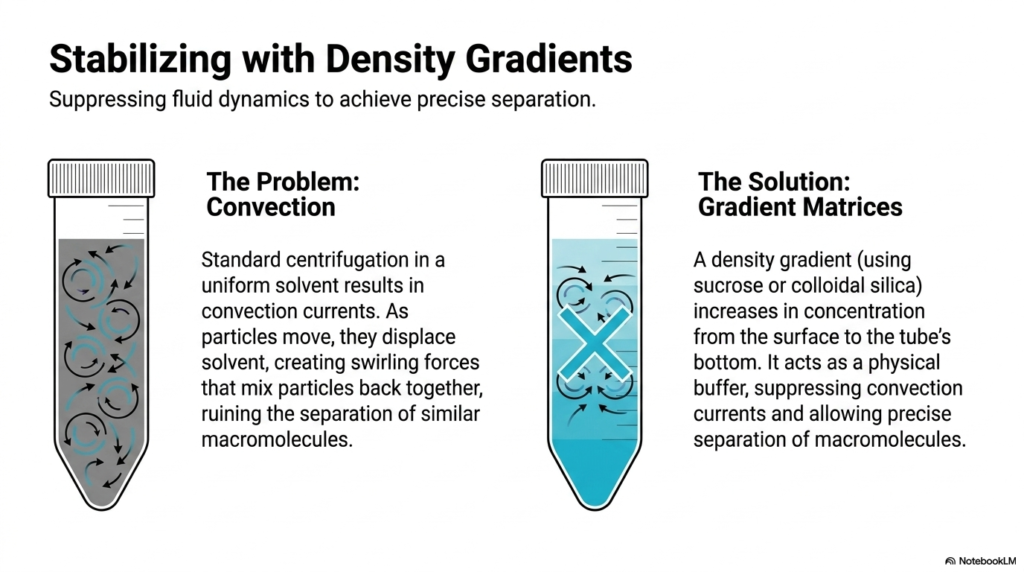
Even with massive rotational forces, microscopic fluid dynamics can easily ruin an experiment. Slide seven addresses a major physical hurdle in Centrifugation Analysis: convection. When standard centrifugation is performed in a uniform solvent, the movement of heavy particles displaces the surrounding liquid. This displacement creates swirling fluid forces, known as convection currents, which actively mix the separated particles right back together.
To combat these destructive swirling forces, biochemists introduce density gradients. A gradient matrix, typically composed of varying concentrations of sucrose or colloidal silica, is layered into the test tube. The concentration of this matrix increases steadily from the top surface down to the bottom of the tube. This gradient acts as a dense physical buffer, suppressing the turbulent fluid dynamics that would otherwise occur during Centrifugation Analysis.
By implementing a density gradient, the solution becomes inherently stable. The heavier, more concentrated liquid at the bottom resists the upward pull of displaced solvent, completely nullifying convection currents. As a result, when biological macromolecules migrate through the fluid, they do so cleanly, without dragging surrounding liquid and debris along. This stabilization is the secret behind achieving ultra-precise isolation of closely related molecules.
Understanding how to suppress fluid dynamics is a vital skill for conducting advanced Centrifugation Analysis. Without these stabilizing matrices, it would be physically impossible to separate macromolecules that have only slight differences in their sedimentation coefficients. The visual contrast between the chaotic, swirling arrows in the uniform solvent and the calm descent in the gradient matrix perfectly illustrates this physical concept. A properly poured gradient transforms a turbulent environment into a perfectly calm medium.
Slide 8: Mechanism of Zonal Centrifugation Analysis
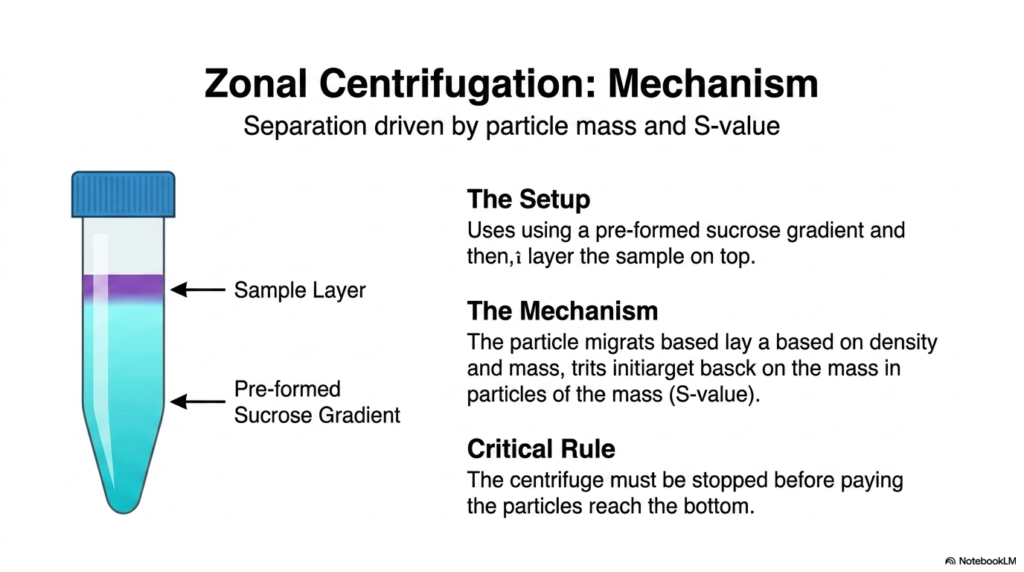
Slide eight dives into the mechanics of rate-zonal separation, a widely used methodology in the field. Centrifugation Analysis using the zonal technique relies strictly on separating particles based on their mass and unique S-values. The setup requires immense care; scientists must manually pour a preformed sucrose gradient into the tube before the experiment begins, ensuring that the density gradually increases toward the bottom.
Once the stabilizing gradient is prepared, the biological sample is delicately layered as a very thin band on the surface of the liquid. As the machine spins, the separation mechanism takes over. Because the gradient suppresses convection, the biological particles migrate downward solely due to their size and mass. The heavier macromolecules with larger S-values plunge through the sucrose faster than the smaller, lighter molecules.
A critical rule governs this type of Centrifugation Analysis: the machine must be stopped before the particles reach the bottom of the tube. Because zonal techniques separate by migration speed rather than buoyant equilibrium, letting the spin run for too long will cause all the distinct bands to crash together into a useless pellet at the base. Timing is an absolute necessity for success.
For laboratory students executing zonal Centrifugation Analysis, precision is everything. The visual representation highlights the care required during sample loading, with a distinct purple band resting gently atop the blue gradient. A heavy-handed pipetting technique could pierce the gradient, mixing the sample prematurely. This technique is incredibly powerful for separating cellular components that share similar densities but differ greatly in their overall molecular mass.
Slide 9: Zonal Migration Over Time in Centrifugation Analysis
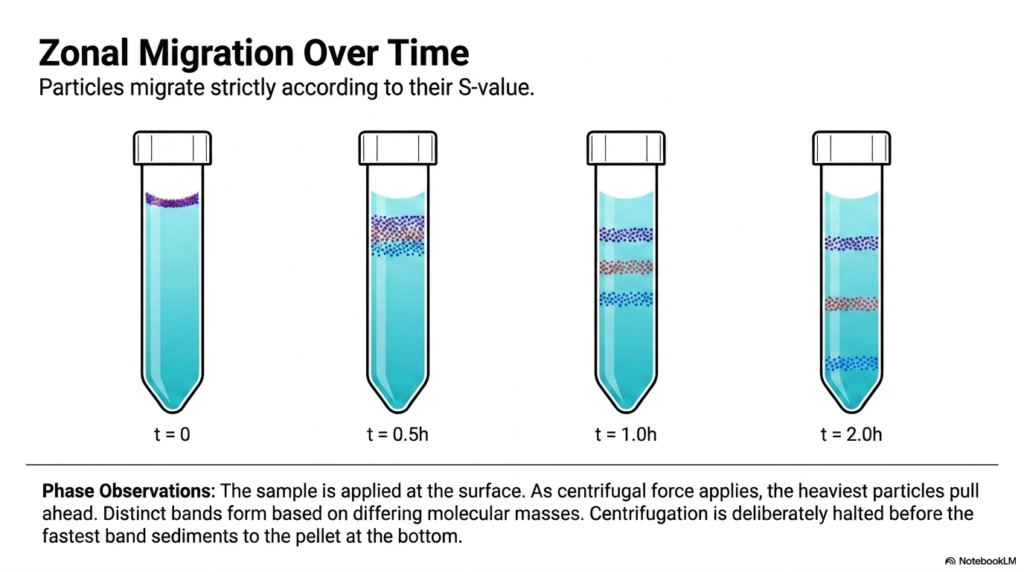
To truly understand rate-zonal separation, one must visualize how the molecules behave dynamically over time. Slide nine provides a critical time-lapse view of zonal Centrifugation Analysis, illustrating exactly how a single mixed sample separates into beautiful, distinct bands. At time zero, the mixture sits completely unseparated at the surface, waiting for centrifugal force to initiate the molecular race down the tube.
As the hours progress, the kinetic differences between the biological particles become visually apparent. Because migration in this form of Centrifugation Analysis is strictly governed by the sedimentation coefficient, the heaviest particles rapidly pull ahead of the pack. By the thirty-minute mark, the initial sample layer begins to widen and fracture. By the first hour, distinct biological fractions are actively distancing themselves from one another within the stabilizing sucrose matrix.
When the spin reaches the two-hour mark, perfect phase observation is achieved. The heaviest macromolecules form the lowest band, intermediate structures sit in the middle, and the lightest proteins trail behind near the top. This is the exact moment when the biochemist must halt the Centrifugation Analysis. The separation is entirely time-dependent; if the rotor continues to spin, the fastest band will eventually crash into the bottom of the tube.
This time-lapse underscores the importance of mathematical prediction in laboratory science. Students must calculate the expected velocities of their specific target molecules to know precisely when to hit the stop button. The gradient has successfully acted as a highly tuned racetrack where mass dictates the winner. The visual progression from a chaotic mixture to orderly, distinct layers demonstrates how leveraging particle mass systematically unravels complex cellular machinery.
Slide 10: Mechanism of Isopyknic Centrifugation Analysis
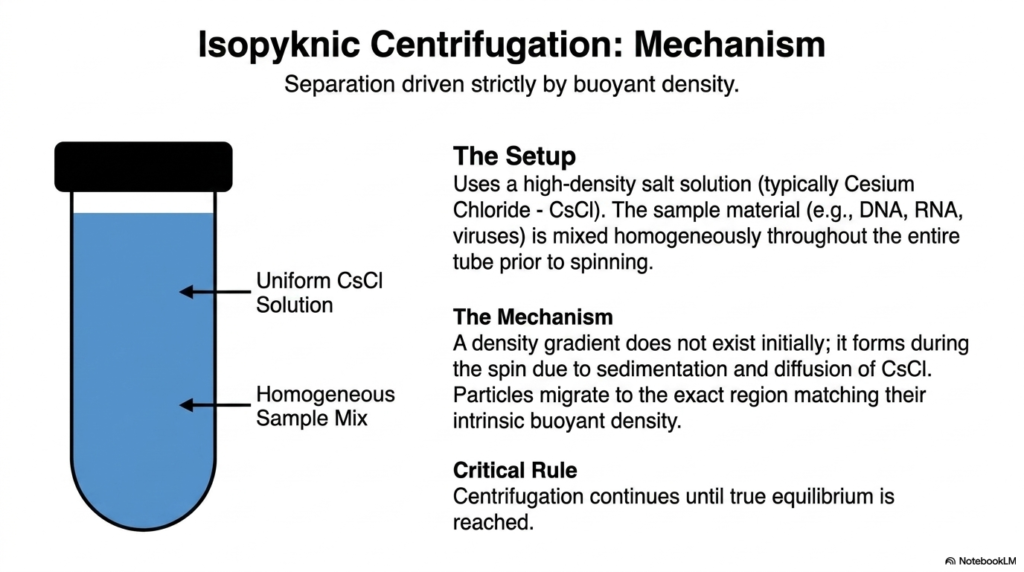
While zonal techniques rely on a molecular race, isopyknic separation operates on a completely different principle. Slide ten introduces the mechanism of isopyknic Centrifugation Analysis, a method in which separation is driven entirely by a particle’s buoyant density, ignoring its mass. This technique requires a heavy liquid solvent, typically a high-density salt solution such as cesium chloride, capable of matching the extreme densities of nucleic acids like DNA and RNA.
Unlike the careful layering required in zonal methods, the setup for isopyknic Centrifugation Analysis is beautifully simple. The biological sample and the heavy salt solution are mixed uniformly throughout the entire tube before the machine is even turned on. Initially, there is no density gradient at all. The gradient actually self-generates during the massive rotational spin due to the sedimentation and diffusion of the heavy salt ions themselves.
As this self-forming gradient establishes itself, the homogeneously mixed biological particles begin to migrate. They travel up or down the tube until they reach a region where the surrounding fluid matches their exact intrinsic buoyant density. The critical rule for this form of Centrifugation Analysis is patience. The experiment must continue running, often for several days, until true equilibrium is reached and all molecules have settled into their stable density zones.
This methodology represents a brilliant manipulation of physical chemistry. Because the biological molecules are seeking a point of neutral buoyancy, their starting position inside the tube is irrelevant. A DNA strand starting at the bottom will float up, while an identical strand starting at the top will sink, eventually meeting in the same distinct band. This self-correcting mechanism makes isopyknic methods incredibly robust for isolating genetic material.
Slide 11: Isopyknic Migration Over Time in Centrifugation Analysis
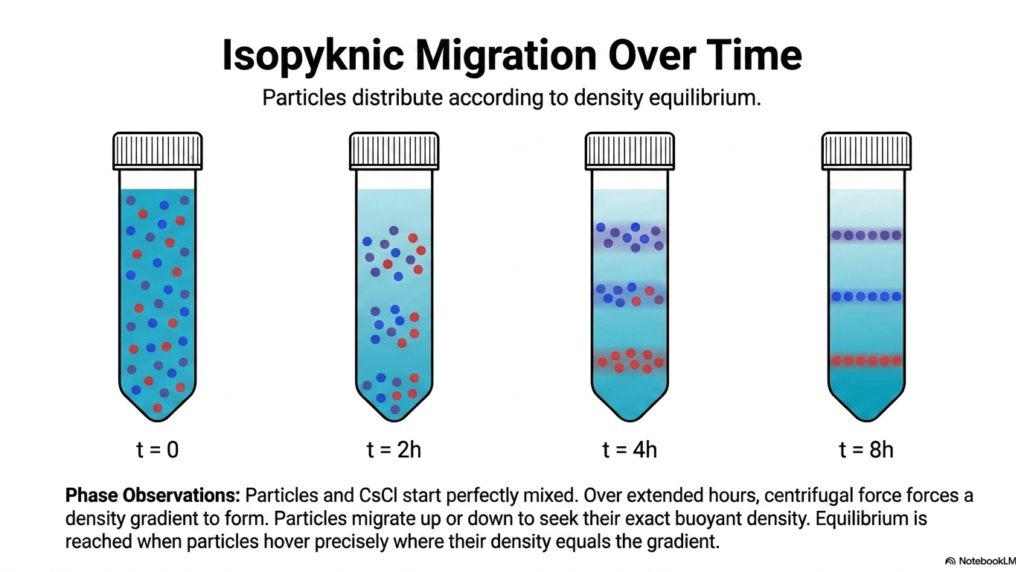
To conceptualize equilibrium, slide eleven provides a time-lapse of the isopyknic process. Observing this specific Centrifugation Analysis over time highlights the slow, deliberate nature of density-driven separation. At time zero, the tube is a chaotic, homogeneous mixture; the biological particles and the heavy Cesium Chloride salt ions are completely distributed from top to bottom. There is no structural organization, and the solvent density is identical throughout the entire column.
As the centrifuge applies immense force over the first few hours, a profound physical change occurs within the solvent. The heavy salt ions are pushed toward the bottom, dynamically generating a density gradient. Simultaneously, the biological particles begin their migration. Because this form of Centrifugation Analysis isolates based on neutral buoyancy, particles will move in opposite directions. Molecules in a denser liquid will float upward, while those in a lighter one will slowly sink.
By the eighth hour, and often much longer, the system reaches absolute equilibrium. This is the hallmark of successful isopyknic Centrifugation Analysis. The particles hover precisely where their intrinsic density matches the newly formed gradient, remaining permanently locked in place regardless of how much longer the machine spins. The distinct bands formed at this stage represent incredibly pure fractions of biological material, separated entirely by their specific gravity.
This temporal view reinforces the robust, self-correcting nature of the isopyknic method. The visual transition from randomly scattered dots to tightly packed, perfectly horizontal bands is a testament to the laws of physical chemistry. This equilibrium state is essential when scientists must distinguish among different DNA isotopes in complex genetic experiments. By forcing molecules to find their buoyant resting place, biochemists uncover minute structural differences within cellular machinery.
Slide 12: Isolating the Results in Centrifugation Analysis
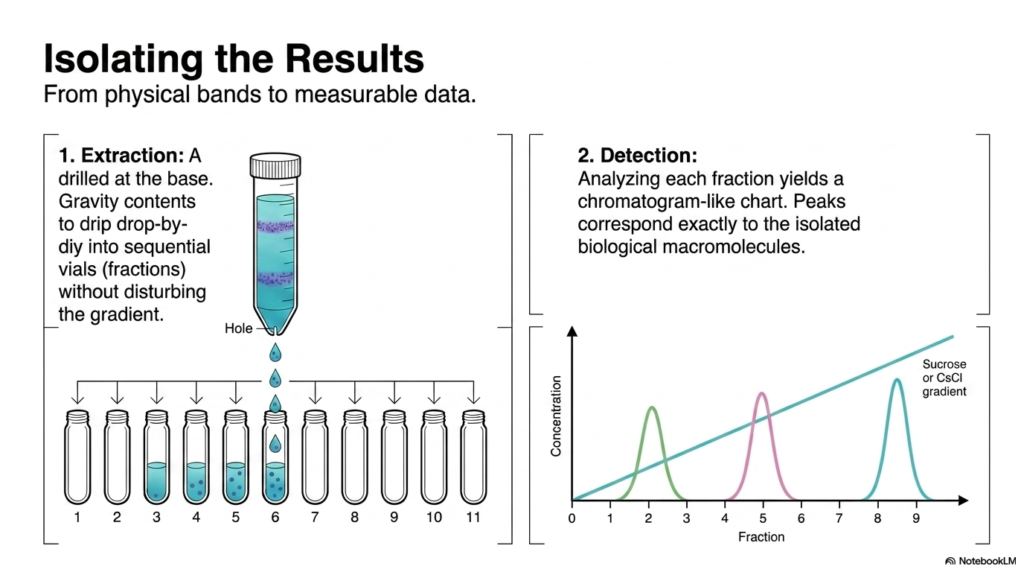
Creating beautiful, separated bands inside a test tube is only half the battle. Slide twelve addresses the critical final step of any Centrifugation Analysis: extracting the biological material to generate measurable, actionable data. Once the high-speed spin is complete, the researcher must carefully remove the delicate gradient without disturbing the distinct layers that the machine has just painstakingly separated.
The extraction process relies on remarkable precision and simple gravity. A tiny hole is physically drilled into the base of the plastic test tube. As the gradient slowly drips out of the bottom, the contents are collected drop by drop into a series of vials, known as fractions. This physical fractionation process translates the spatial separation achieved during Centrifugation Analysis into isolated, pure liquid samples that can be tested individually in the laboratory.
Once the fractions are collected, the detection phase begins. By analyzing the biological concentration within each successive vial, biochemists can plot the data on a chromatogram-like chart. The horizontal axis represents the fraction number, and the vertical axis represents the concentration of the target molecule. This chart transforms the visual bands of a Centrifugation Analysis experiment into hard, quantifiable data peaks corresponding exactly to the isolated biological macromolecules.
For medical and biochemical students, understanding this transition from physical liquid to data analysis is paramount. The elegance of this extraction method lies in its simplicity. Despite utilizing machinery capable of generating hundreds of thousands of times the force of gravity, the final retrieval relies on the gentle, steady drip of normal Earth gravity. Careful fractionation ensures that the highly concentrated bands do not prematurely mix as they exit the tube.
Slide 13: Methodology Matrix for Centrifugation Analysis
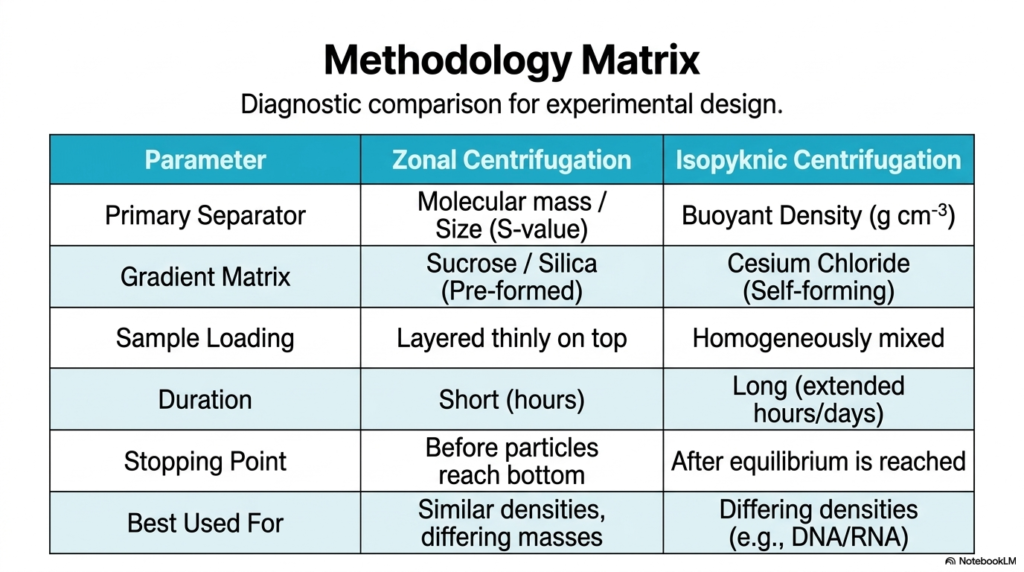
The final slide presents a comprehensive methodology matrix that serves as the definitive diagnostic comparison for experimental design. Knowing when to apply different forms of Centrifugation Analysis is what separates a novice student from an expert biochemist. This table directly contrasts the two heavyweight techniques discussed throughout the deck: rate-zonal separation and isopyknic separation. It acts as a master key for researchers deciding how to tackle complex biological mixtures.
When analyzing the primary separators, the matrix reiterates that zonal methods separate by molecular mass and S-value, while isopyknic methods separate strictly by intrinsic buoyant density. Because of these distinct physical principles, the gradient matrices must also differ. Zonal Centrifugation Analysis requires carefully preformed sucrose gradients, whereas isopyknic methods utilize dense Cesium Chloride solutions that self-form a gradient during centrifugation.
The table also highlights stark differences in sample loading and duration. Zonal techniques require the sample to be layered thinly on top and run for only a few short hours. Conversely, an isopyknic Centrifugation Analysis demands that the sample be homogeneously mixed into the salt and run for extended hours, or even days, until perfect equilibrium is achieved. Furthermore, zonal spins must be stopped manually, while isopyknic spins can run indefinitely without damage.
This matrix perfectly summarizes the best-use cases for each experimental methodology. Understanding this matrix empowers researchers to avoid costly laboratory errors. Choosing the wrong gradient matrix or sample loading technique will destroy the molecular structures before the analysis yields data. Ultimately, this slide synthesizes the complex physics, rotor mechanics, and mathematical formulas from the entire presentation into a practical, actionable guide for real-world biochemical problem-solving.
Please read our Content Disclaimer Statement.
Check out our social media channels: