124. Urine Biochemistry: An Analysis of Excretory Chemical Composition
Have you ever wondered how a simple clinical fluid sample can offer a complete window into human metabolism? The study of renal excretion reveals how the body clears toxic metabolic waste, balances vital fluids, and maintains systemic balance. This comprehensive slide deck breaks down the complex physiological mechanisms behind renal diagnostics for college and medical school students. By exploring the organic and inorganic molecules excreted daily, students will gain a foundational understanding of metabolic pathways, liver biotransformation, and diagnostic biomarkers essential for modern medicine and clinical pathology.
Slide 1: Introduction to Urine Biochemistry and Clinical Diagnostics
The opening slide introduces the core principles of Urine Biochemistry, establishing renal excretion as an essential window into human metabolism. Every second, metabolic pathways throughout the body generate nitrogenous waste, organic acid metabolites, and excess ions that must be eliminated efficiently. By studying Urine Biochemistry, students learn how the renal system maintains systemic homeostasis while processing metabolic end-products from protein, nucleotide, and carbohydrate turnover.
At the cellular level, metabolic activities produce a wide array of water-soluble molecules and potentially toxic byproducts that pass through the nephrons. Renal tubules carefully filter, reabsorb, and secrete these molecules based on plasma concentrations, hormonal signaling, and acid-base demands. Through the lens of Urine Biochemistry, medical trainees observe how physiological mechanisms transform complex blood plasma into a highly regulated excretory fluid that reflects overall cellular health.
Understanding this biological fluid requires analyzing both normal baseline parameters and pathological variations across diverse physiological states. Clinical pathology uses these chemical markers to assess kidney filtration efficiency, hepatic biotransformation, tissue degradation, and metabolic stress without invasive procedures.
This introductory section establishes the broader scientific context for evaluating specific organic compounds, inorganic electrolytes, and diagnostic biomarkers. By mastering these excretory concepts, future clinicians gain the critical skills needed to interpret routine laboratory findings and diagnose complex metabolic disorders effectively.
Slide 2: The 24-Hour Fluid Baseline in Urine Biochemistry
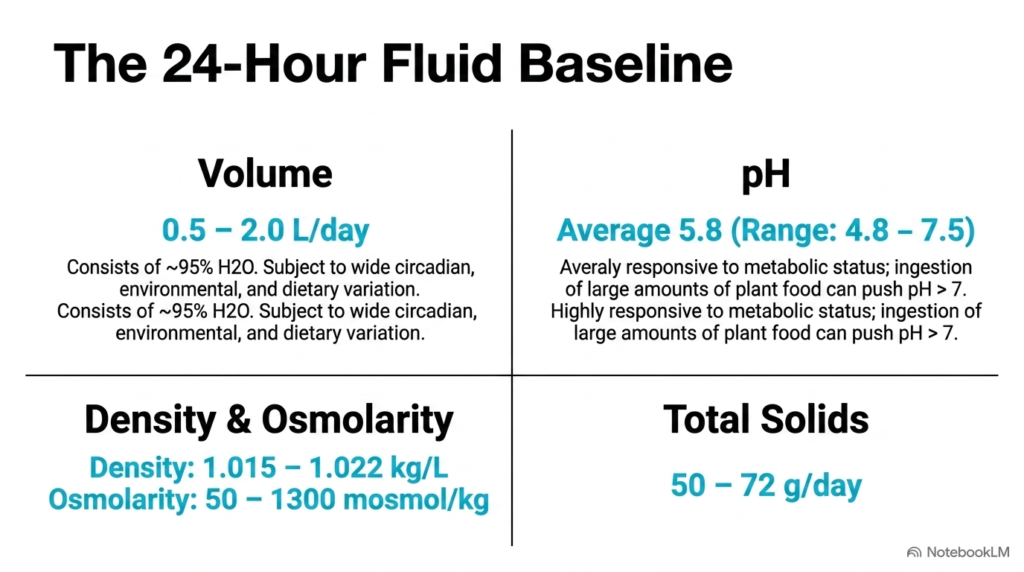
Slide two outlines the physiological baseline parameters of human excretion, highlighting key volumetric and physical characteristics in urine biochemistry. On average, a healthy adult produces 0.5 to 2.0 liters of fluid per day, about 95% of which is water. Daily volume fluctuates significantly based on fluid intake, environmental temperature, physical activity, and physiological hydration demands.
Another crucial baseline parameter in Urine Biochemistry is pH, which averages 5.8 but ranges from 4.8 to 7.5. The kidneys actively regulate hydrogen ion excretion to balance systemic acid-base status. Dietary choices strongly influence this value; for example, large amounts of plant-based foods can raise pH above 7.0 due to alkaline ash production, whereas high-protein diets increase acidity.
The slide also details density and osmolarity, which measure solute concentration and renal concentrating ability. Normal urine density ranges from 1.015 to 1.022 kg/L, while osmolarity spans 50 to 1300 mosmol/kg depending on hydration. Total excreted solids range from 50 to 72 grams daily and include dissolved organic metabolites and inorganic salts.
In urine biochemistry, monitoring these baseline physical properties gives clinicians vital information about renal concentration mechanisms and fluid balance. Deviations in volume, pH, or osmolarity often serve as early indicators of tubular dysfunction, diabetes insipidus, or systemic metabolic acid-base disturbances.
Slide 3: The Nitrogenous Triad in Urine Biochemistry
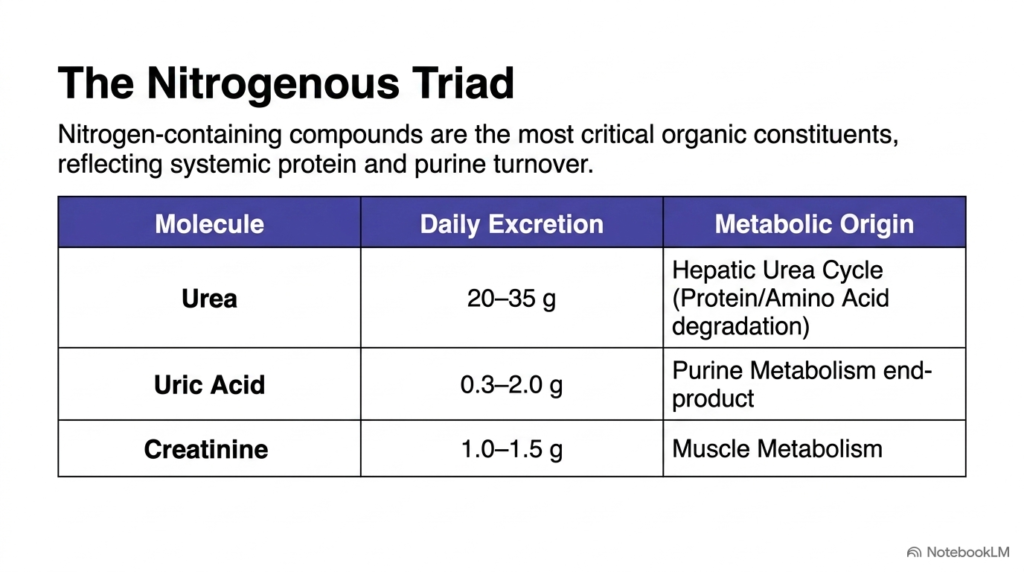
Slide three introduces the nitrogenous triad, three fundamental organic compounds that represent the cornerstone of Urine Biochemistry. Organic nitrogen-containing molecules constitute the largest portion of dissolved solids in human excretion. These compounds directly mirror systemic protein degradation, purine nucleotide turnover, and skeletal muscle energy metabolism occurring continuously throughout the human body.
The primary member of this triad is urea, which accounts for most nitrogen excretion at 20 to 35 grams daily. Derived from the hepatic urea cycle, urea disposal prevents toxic ammonium accumulation following amino acid deamination. Understanding urea dynamics in Urine Biochemistry helps students evaluate whole-body protein balance and liver synthetic capacity under varying nutritional states.
The second component, uric acid, is excreted at 0.3 to 2.0 grams per day as the ultimate breakdown product of purine nucleosides. The final member, creatinine, is excreted at 1.0 to 1.5 grams daily as a byproduct of muscle energy metabolism. Creatinine output remains remarkably constant because it correlates directly with total skeletal muscle mass.
Together, these three molecules show how urine biochemistry reflects tissue metabolism quantitatively. By tracking the excretion rates of urea, uric acid, and creatinine, medical professionals can assess protein intake, purine degradation pathways, and baseline glomerular filtration efficiency in clinical settings.
Slide 4: Urea Synthesis and Clearance in Urine Biochemistry
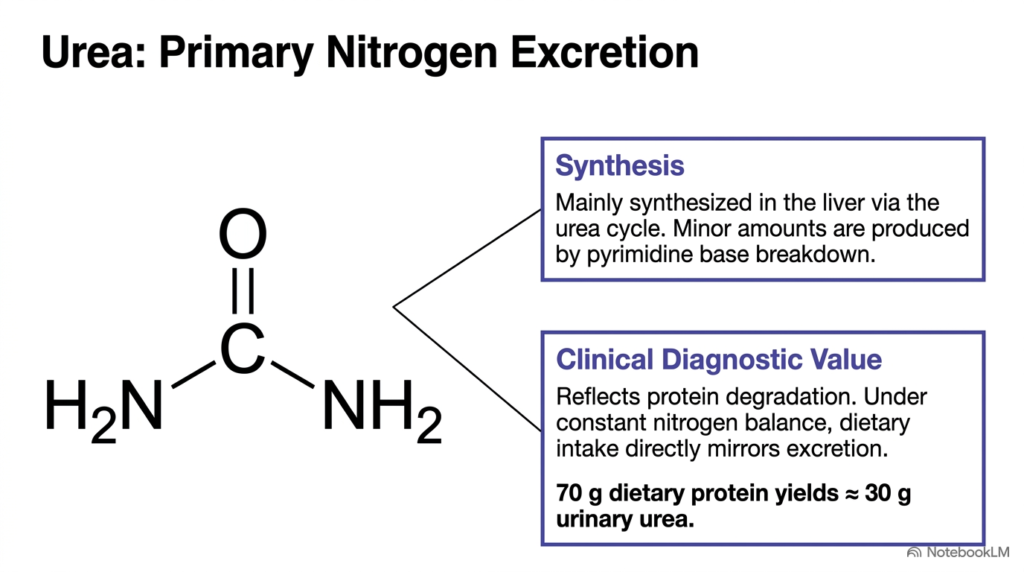
Slide four focuses specifically on urea, the dominant organic waste molecule analyzed in Urine Biochemistry. Chemically structured as a central carbonyl group bonded to two amino groups, urea serves as the principal vehicle for removing excess nitrogen from the body. The liver synthesizes urea through the urea cycle, converting toxic ammonia generated during amino acid catabolism into a neutral, water-soluble compound.
In urine biochemistry, urea excretion directly reflects dietary protein intake and systemic protein catabolism. When nitrogen intake remains stable, daily urea output directly mirrors protein consumption. For instance, a standard daily intake of 70 grams of dietary protein yields approximately 30 grams of urinary urea, demonstrating a tight metabolic coupling between diet and renal clearance.
Minor amounts of urea also originate from pyrimidine base degradation, though hepatic amino acid breakdown remains the dominant source. Because urea passes freely through the renal glomerulus before undergoing partial tubular reabsorption, measuring its concentration provides valuable insight into glomerular filtration and nitrogen equilibrium.
Mastering urea kinetics in urine biochemistry helps students understand clinical conditions such as azotemia and uremia. Elevated blood urea nitrogen often signals impaired renal clearance or excessive tissue catabolism, making urinary urea measurements a crucial diagnostic tool in clinical nephrology and nutrition management.
Slide 5: Uric Acid and Purine Degradation in Urine Biochemistry
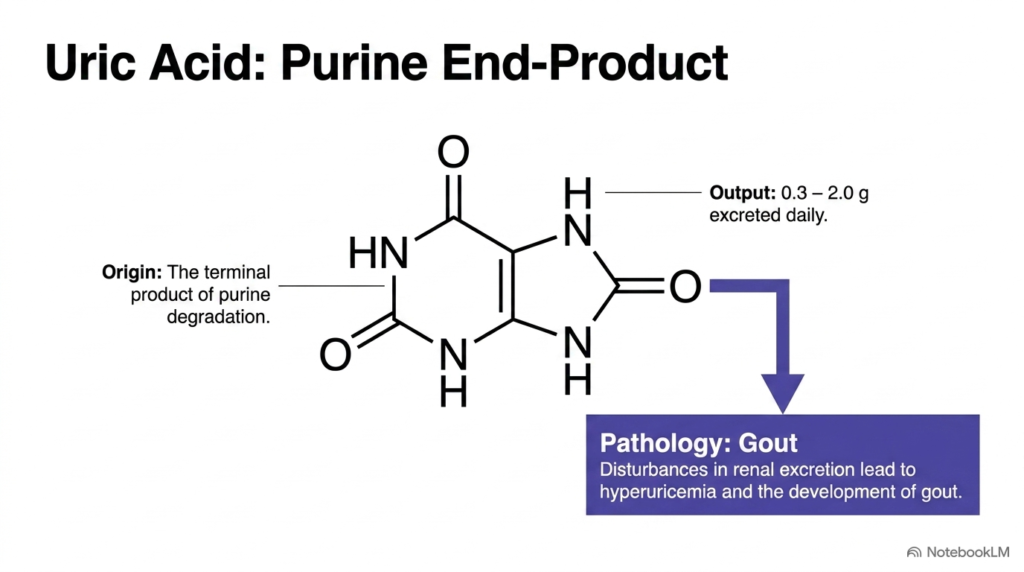
Slide five examines uric acid, an essential heterocyclic purine derivative central to Urine Biochemistry. Uric acid represents the final metabolic product of purine nucleoside catabolism in humans. Adenine and guanine from cellular nucleic acids and dietary purines undergo sequential enzymatic oxidation, culminating in uric acid production, which the kidneys excrete at 0.3 to 2.0 grams daily.
Because of its complex ring structure, uric acid has limited solubility in aqueous solutions, making its renal management a critical topic in Urine Biochemistry. At physiological pH, uric acid exists predominantly as monosodium urate. When urine becomes overly acidic or urate concentration exceeds solubility limits, urate crystals readily precipitate within renal tubules or urinary passages.
Pathological disturbances in uric acid production or excretion lead to hyperuricemia, the primary cause of gout. In gouty arthritis, needle-like urate crystals deposit in joint spaces, triggering severe inflammatory responses. Additionally, excessive urinary uric acid excretion can lead to nephrolithiasis, forming painful kidney stones that obstruct urine flow.
Evaluating uric acid excretion patterns in urine biochemistry allows clinicians to differentiate between purine overproduction and renal underexcretion. Understanding these metabolic pathways helps students grasp how pharmacological agents, such as xanthine oxidase inhibitors and uricosuric drugs, restore biochemical balance in hyperuricemic patients.
Slide 6: Creatinine as a Muscle Biomarker in Urine Biochemistry
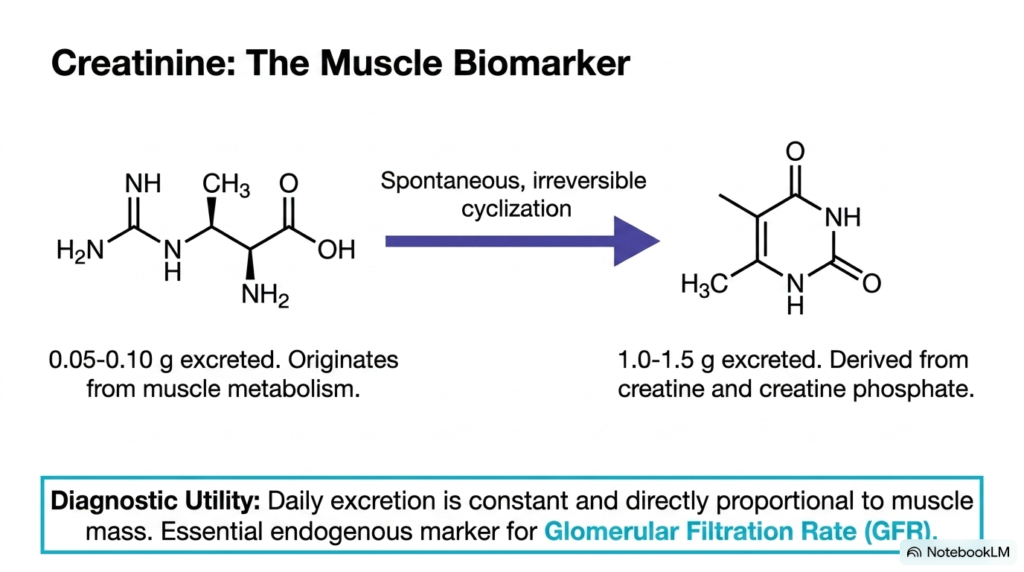
Slide six details creatinine, one of the most reliable endogenous functional markers studied in Urine Biochemistry. Creatinine forms through the spontaneous, irreversible cyclization of creatine and creatine phosphate in skeletal muscle tissue. The body excretes small amounts of free creatine (0.05 to 0.10 grams) daily, while creatinine output remains substantially higher at 1.0 to 1.5 grams per day.
Because creatine conversion occurs non-enzymatically at a constant daily rate, creatinine production remains remarkably steady and directly proportional to total skeletal muscle mass. In Urine Biochemistry, this consistency makes creatinine an invaluable reference standard. Because daily output does not fluctuate with dietary changes or urine flow rates, clinicians use creatinine excretion to verify the completeness of 24-hour urine collections.
Furthermore, creatinine plays a central role in assessing renal function because it undergoes complete glomerular filtration with minimal tubular reabsorption or secretion. Measuring urinary creatinine alongside plasma concentrations allows researchers and physicians to calculate the Glomerular Filtration Rate, providing an accurate mathematical assessment of functional nephron mass.
Analyzing creatinine excretion dynamics in urine biochemistry helps students see how skeletal muscle energy metabolism integrates with renal clearance mechanisms. Understanding this biomarker is essential for identifying acute kidney injury, chronic renal failure, and muscle wasting syndromes in clinical practice.
Slide 7: Free Amino Acids and Detoxification in Urine Biochemistry
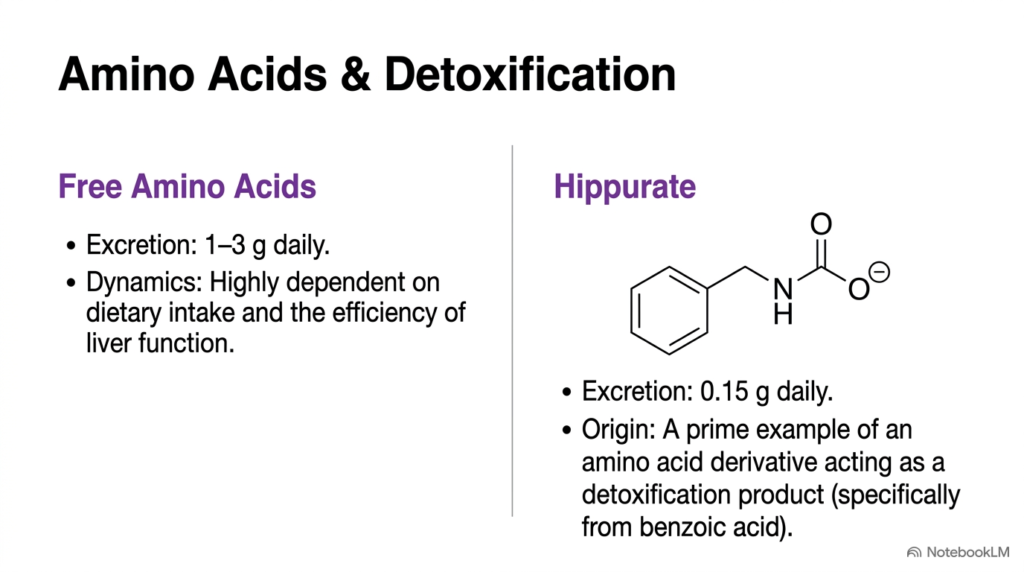
Slide seven addresses the excretion of free amino acids and specialized conjugate molecules in urine biochemistry. Under normal physiological conditions, the renal tubules reabsorb nearly all filtered amino acids, resulting in a minimal daily excretion of only 1 to 3 grams. Excretion dynamics depend heavily on dietary protein intake, renal tubular reabsorption efficiency, and hepatic metabolic function.
In addition to free amino acids, this slide highlights hippurate as a prime example of hepatic detoxification studied in Urine Biochemistry. Hippurate excretion averages 0.15 grams daily and forms when the liver conjugates benzoic acid—an aromatic compound found in plant foods—with glycine. This conjugation reaction increases water solubility, allowing the kidneys to clear xenobiotics efficiently.
Excitatory or impaired tubular transport mechanisms can lead to aminoaciduria, where excessive amounts of amino acids appear in the urine. Overflow aminoaciduria occurs when plasma amino acid levels exceed reabsorptive thresholds, as seen in phenylketonuria, whereas renal aminoaciduria stems from defective tubular transport proteins, as observed in Hartnup disease or cystinuria.
Analyzing amino acid clearance within Urine Biochemistry gives students a clear understanding of metabolic conjugation and renal transport kinetics. Studying these pathways illustrates how hepatic biotransformation and renal tubular transport cooperate to eliminate potentially toxic organic molecules from systemic circulation.
Slide 8: Biomarkers of Tissue Breakdown in Urine Biochemistry
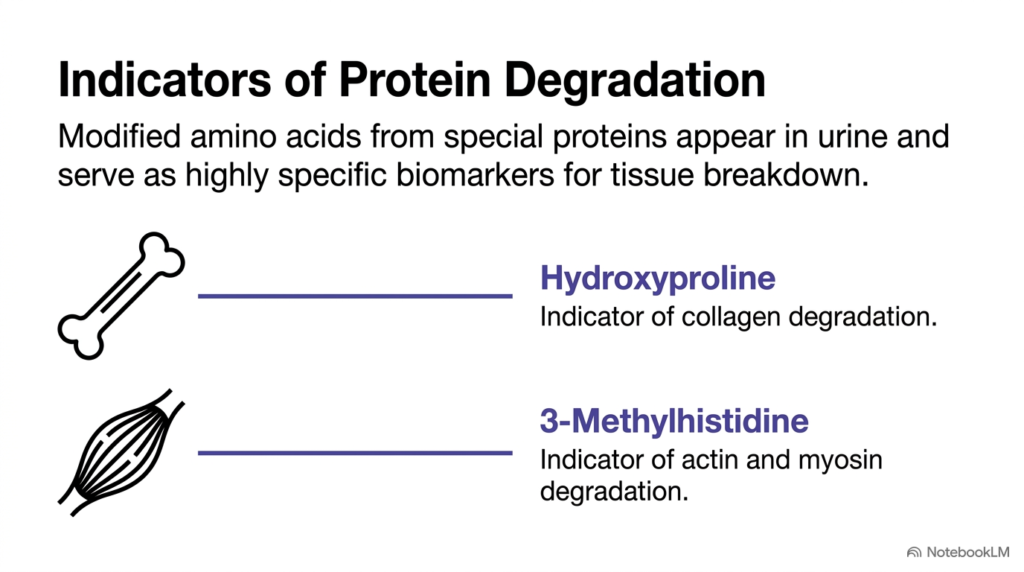
Slide eight introduces modified amino acids that serve as highly specific indicators of tissue breakdown in Urine Biochemistry. When specialized structural proteins undergo post-translational modifications and subsequent enzymatic degradation, their modified amino acid residues cannot be reused for new protein synthesis. Consequently, these molecules pass into the bloodstream and are excreted directly in urine.
A prominent biomarker featured in this section of Urine Biochemistry is hydroxyproline. Formed by post-translational hydroxylation of proline residues in collagen, hydroxyproline release directly reflects bone matrix turnover and connective tissue degradation. Elevated urinary hydroxyproline levels often indicate increased bone resorption, as seen in conditions such as Paget’s disease, hyperparathyroidism, or metastatic bone lesions.
Another key modified amino acid is 3-methylhistidine, a specific biomarker for skeletal muscle breakdown. Post-translational methylation of histidine occurs exclusively within actin and myosin filaments. Following myofibrillar protein degradation, 3-methylhistidine cannot be reloaded onto transfer RNA and is quantitatively excreted, providing a direct measurement of muscle protein catabolism.
Tracking these specialized biochemical biomarkers in urine biochemistry gives clinicians powerful, non-invasive tools to evaluate tissue-specific turnover rates. Students learn how distinct post-translational modifications allow researchers to isolate bone remodeling and skeletal muscle catabolism from generalized systemic protein degradation, improving diagnostic precision in clinical medicine.
Slide 9: Hepatic Biotransformation and Conjugates in Urine Biochemistry
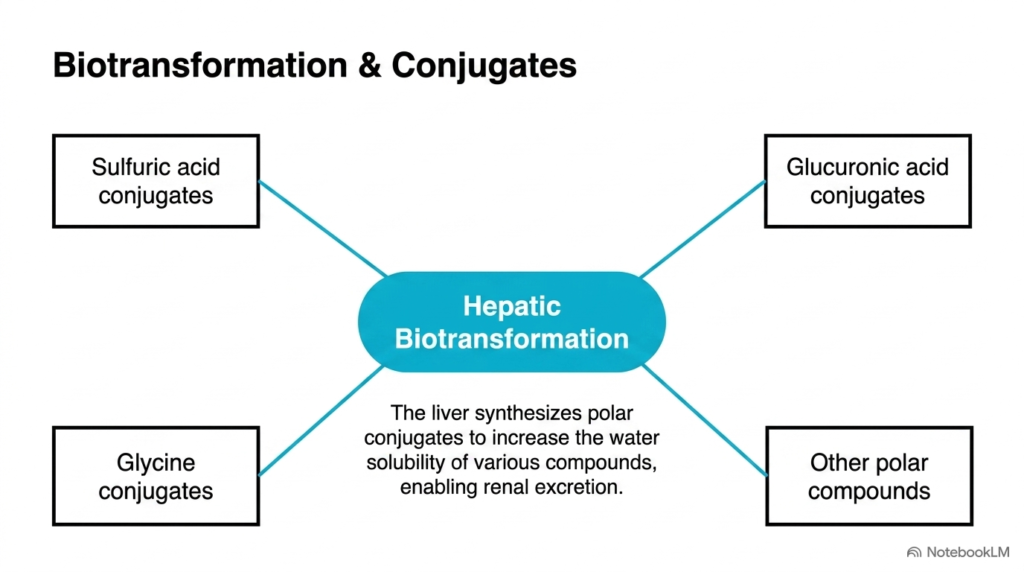
Slide nine illustrates hepatic biotransformation processes that prepare non-polar endobiotics and xenobiotics for renal excretion, an essential concept in Urine Biochemistry. Many hydrophobic metabolic waste products, lipophilic drugs, and environmental toxins cannot be excreted efficiently by the kidneys in their native forms because they bind tightly to plasma proteins and undergo complete renal tubular reabsorption.
To facilitate elimination, phase II biotransformation reactions in the liver attach polar hydrophilic groups to these lipophilic compounds, a mechanism thoroughly investigated in Urine Biochemistry. The liver synthesizes four primary categories of polar conjugates: glucuronic acid conjugates, sulfuric acid conjugates, glycine conjugates, and other polar derivatives that dramatically increase water solubility.
Glucuronidation, catalyzed by UDP-glucuronosyltransferases, converts bilirubin, steroid hormones, and NSAIDs into highly water-soluble glucuronides. Sulfation converts xenobiotics and catecholamines into ester sulfates, whereas amino acid conjugation attaches glycine to aromatic acids like benzoate. Once conjugated, these polar derivatives easily dissolve in blood plasma and filter through the renal glomerulus.
Understanding hepatic conjugation pathways in urine biochemistry highlights the vital physiological coordination between liver metabolism and kidney excretion. Impairments in hepatic biotransformation diminish renal clearance, leading to toxin accumulation and drug toxicity in patients with liver or renal insufficiency.
Slide 10: Endocrine Diagnostics and hCG in Urine Biochemistry
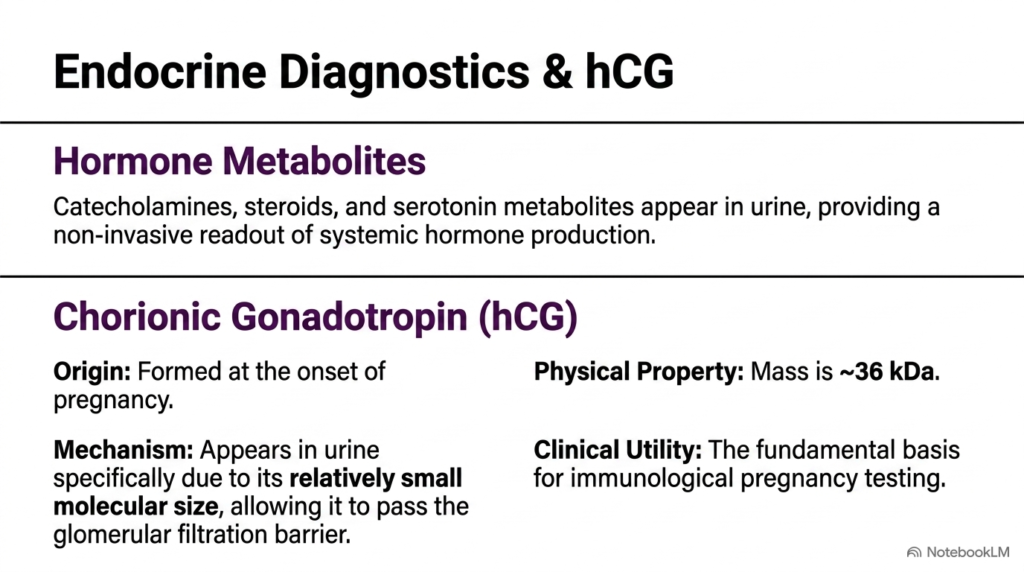
Slide ten focuses on endocrine diagnostics, explaining how Urine Biochemistry analyzes hormone metabolites and specific peptide markers. The urinary excretion of hormone derivatives—including metabolites of catecholamines, steroid hormones, and serotonin—provides a non-invasive, integrated readout of systemic endocrine gland activity over extended time periods.
A major clinical marker highlighted in this branch of Urine Biochemistry is human Chorionic Gonadotropin (hCG). Synthesized by syncytiotrophoblast cells following blastocyst implantation, hCG maintains the corpus luteum during early pregnancy. Chemically, hCG is a heterodimeric glycoprotein with a molecular mass of approximately 36 kilodaltons, making it relatively small compared to bulky plasma proteins like albumin.
Because of its small molecular size and favorable surface charge, hCG readily crosses the renal glomerular filtration barrier into the tubular fluid. This physiological filtration mechanism forms the biochemical basis for modern point-of-care immunological pregnancy tests, which use specific monoclonal antibodies to detect urinary hCG within minutes.
Evaluating endocrine excretory profiles in Urine Biochemistry allows medical professionals to diagnose pheochromocytomas via catecholamine metabolites like vanillylmandelic acid, monitor adrenal function, and confirm early gestations. These diagnostic applications demonstrate how renal filtration serves as a window into systemic hormonal regulation and reproductive health.
Slide 11: Urochromes and the Chemistry of Color in Urine Biochemistry
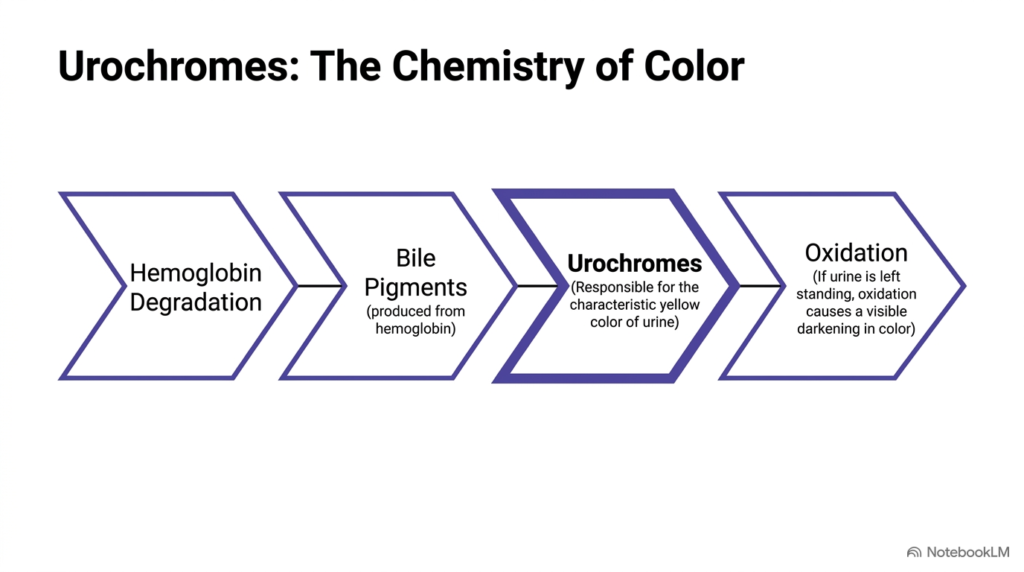
Slide eleven details the chemical origins of urine coloration, exploring specific pigment formation pathways within Urine Biochemistry. Normal urine exhibits a characteristic amber or yellow color derived primarily from urochromes, a specialized class of low-molecular-weight yellow pigments produced during the systemic catabolism and breakdown of heme-containing hemoproteins such as hemoglobin and myoglobin.
The biochemical pathway begins with reticuloendothelial hemoglobin degradation, yielding biliverdin and bilirubin. The liver excretes conjugated bilirubin into bile, where intestinal bacteria reduce it to urobilinogen. A fraction of urobilinogen undergoes enterohepatic reabsorption into plasma and is excreted by the kidneys, where oxidation yields urobilin and related urochromes studied in Urine Biochemistry.
Physical changes in pigment concentration directly mirror hydration status; concentrated urine appears dark amber, whereas dilute urine appears pale yellow. Additionally, when a urine sample is exposed to air, spontaneous non-enzymatic oxidation converts colorless chromogens into oxidized pigments, causing the sample to darken over time.
In clinical Urine Biochemistry, observing pigment variations provides immediate diagnostic clues. Abnormal coloration can indicate intravascular hemolysis, liver disease, biliary obstruction, or drug ingestion. Understanding pigment chemistry helps students link physical sample characteristics to underlying metabolic degradation pathways.
Slide 12: The Inorganic Landscape in Urine Biochemistry
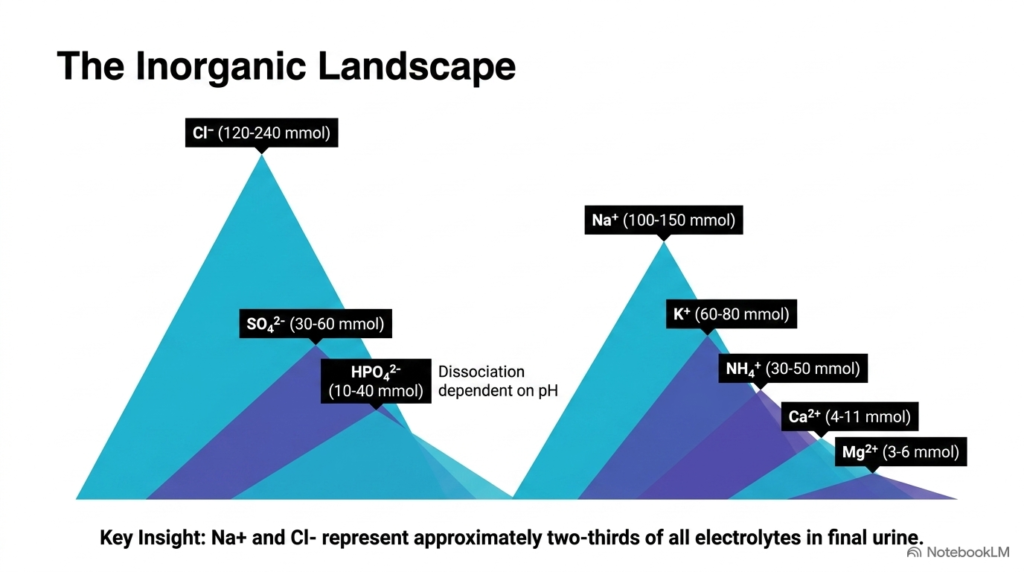
Slide twelve maps out the inorganic electrolyte composition of human excretion, highlighting a core quantitative aspect of Urine Biochemistry. Although organic nitrogenous compounds account for much of the solid mass, inorganic ions critically determine osmotic pressure, electrical neutrality, and fluid-volume regulation in renal physiology.
As the slide shows, sodium (100 to 150 mmol daily) and chloride (120 to 240 mmol daily) make up about two-thirds of all electrolytes in final urine, reflecting their dominant roles in extracellular fluid dynamics. In Urine Biochemistry, quantifying these major electrolytes helps clinicians evaluate extracellular volume regulation and renal tubular ion transport mechanisms.
The slide also details other vital inorganic ions, including potassium (60 to 80 mmol), ammonium (30 to 50 mmol), sulfate (30 to 60 mmol), phosphate (10 to 40 mmol), calcium (4 to 11 mmol), and magnesium (3 to 6 mmol). Phosphate dissociation depends directly on urinary pH, shifting between dihydrogen phosphate and monohydrogen phosphate species to buffer excreted hydrogen ions.
Analyzing the inorganic spectrum in urine biochemistry provides crucial diagnostic insight into electrolyte disorders, mineral metabolism, and tubular transport defects. Medical students learn how the kidney selectively filters and reabsorbs these inorganic species to maintain systemic osmotic equilibrium and acid-base homeostasis.
Slide 13: Regulation of Inorganic Excretion in Urine Biochemistry
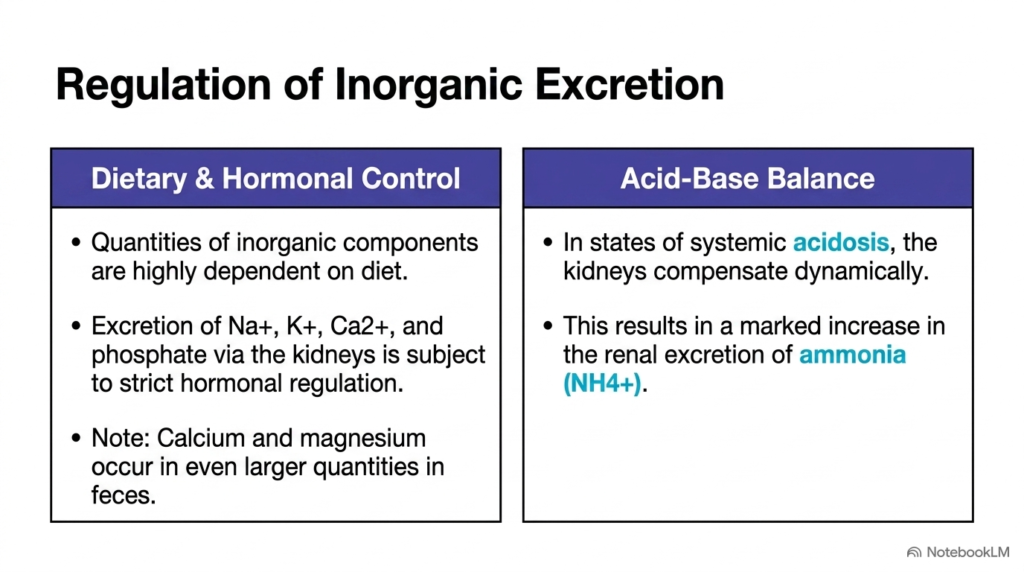
Slide thirteen focuses on the physiological regulation of inorganic excretion, exploring dietary, endocrine, and acid-base controls in Urine Biochemistry. The total quantity of inorganic ions excreted daily depends heavily on dietary intake, but the body continuously fine-tunes it through hormonal signaling pathways that act directly on renal tubular transport proteins.
Hormones strictly regulate the renal clearance of sodium, potassium, calcium, and phosphate. Aldosterone stimulates distal tubular sodium reabsorption while promoting potassium and hydrogen ion excretion. Parathyroid hormone suppresses proximal phosphate reabsorption and enhances distal calcium reabsorption. Interestingly, in Urine Biochemistry, students note that divalent cations like calcium and magnesium are excreted in larger total quantities via feces than urine.
This slide also details renal acid-base compensation during systemic acidosis. When arterial pH drops, the kidneys increase renal ammoniagenesis in proximal tubule cells, generating ammonium ions from glutamine deamination. Excreting ammonium allows the kidneys to eliminate net acid while generating new bicarbonate ions to restore systemic buffering capacity.
Understanding inorganic regulation in urine biochemistry clarifies how the body adjusts renal excretion to match fluctuating dietary inputs and acid-base challenges. Mastering these regulatory mechanisms helps students analyze conditions like hyperaldosteronism, metabolic acidosis, and chronic renal osteodystrophy.
Slide 14: Pathological Urine Components in Urine Biochemistry
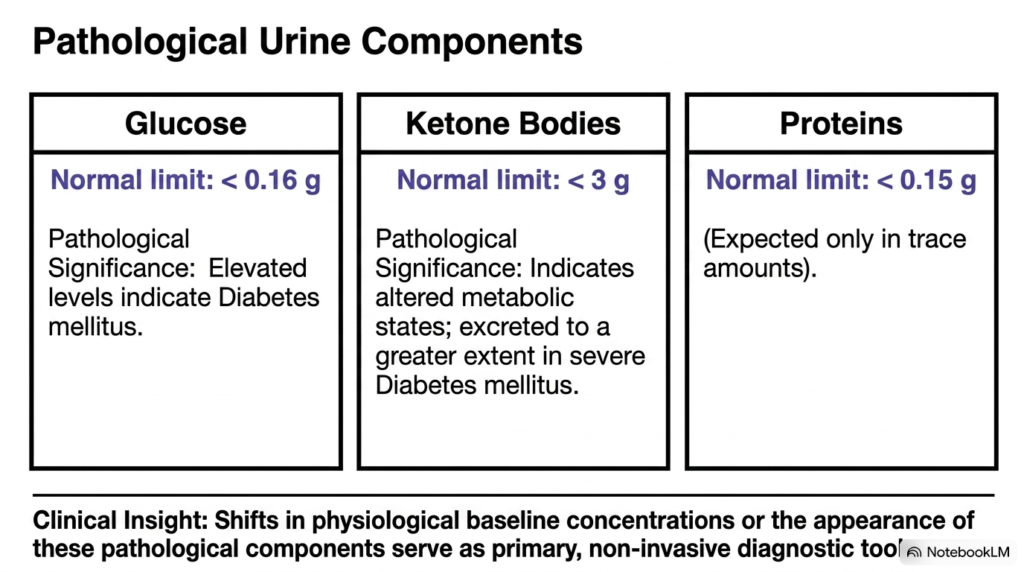
Slide fourteen transitions directly to clinical pathology, highlighting abnormal molecules that serve as critical diagnostic markers in Urine Biochemistry. Under healthy physiological conditions, the selective permeability of the glomerular filtration barrier and efficient tubular reabsorption mechanisms prevent significant urinary loss of energy-rich nutrients and large plasma proteins, keeping baseline excretion limits exceptionally low.
When physiological thresholds are exceeded, abnormal solutes appear, a key diagnostic focus in Urine Biochemistry. Glucosuria occurs when blood glucose exceeds the renal threshold of approximately 180 mg/dL, causing urinary glucose to surpass the normal limit of 0.16 grams daily, a classic hallmark of untreated Diabetes mellitus.
Similarly, ketone bodies—including acetoacetate, beta-hydroxybutyrate, and acetone—normally remain below 3 grams daily. In severe Diabetes mellitus, starvation, or prolonged ketoacidosis, excessive hepatic ketogenesis elevates urinary ketones. Additionally, protein excretion normally remains below 0.15 grams per day; proteinuria indicates glomerular barrier damage or tubular reabsorption failure.
Identifying these abnormal constituents in urine biochemistry gives clinicians essential non-invasive diagnostic tools. Tracking shifts in glucose, ketones, and protein allows medical teams to detect early metabolic dysfunction, monitor diabetic management, and diagnose glomerulonephritis effectively.
Slide 15: Urine as a Systemic Readout in Urine Biochemistry
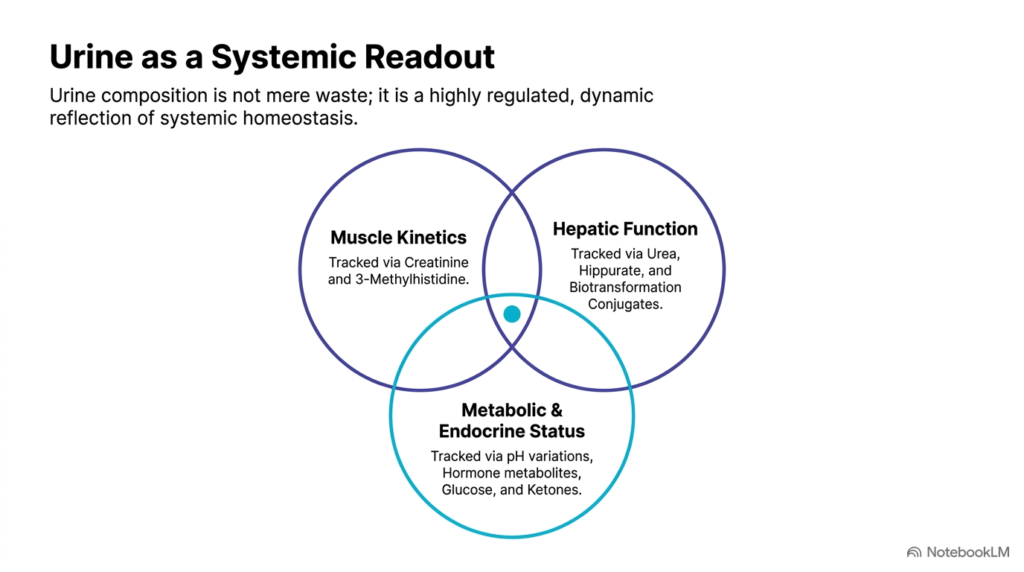
The final slide synthesizes the entire deck, framing human excretion not as mere metabolic waste, but as a dynamic, highly regulated readout in Urine Biochemistry. Excretory fluid reflects integrated whole-body physiological homeostasis, connecting distinct organ systems through shared metabolic pathways and renal clearance mechanisms.
As depicted in the Venn diagram, three primary physiological domains intersect within Urine Biochemistry. Creatinine and 3-methylhistidine excretion track muscle kinetics. Hepatic function is evaluated through urea synthesis, hippurate detoxification, and phase II biotransformation conjugates. Metabolic and endocrine status is monitored via pH fluctuations, hormone metabolites, glucose, and ketone bodies.
When these distinct metabolic domains overlap, they provide a comprehensive multi-organ assessment of patient health. A single non-invasive urine specimen allows clinicians to evaluate muscle catabolism, liver detoxification capacity, endocrine signaling, and renal filtration simultaneously, demonstrating the immense diagnostic power of excretory analysis in modern medicine.
In conclusion, mastering the principles of Urine Biochemistry equips medical students and biochemists with a holistic understanding of metabolic physiology. By analyzing excretory chemistry, healthcare professionals translate molecular data into actionable clinical insights, improving patient diagnostics and treatment monitoring across diverse medical specialties.
Please read our Content Disclaimer Statement.
Check out our social media channels: